
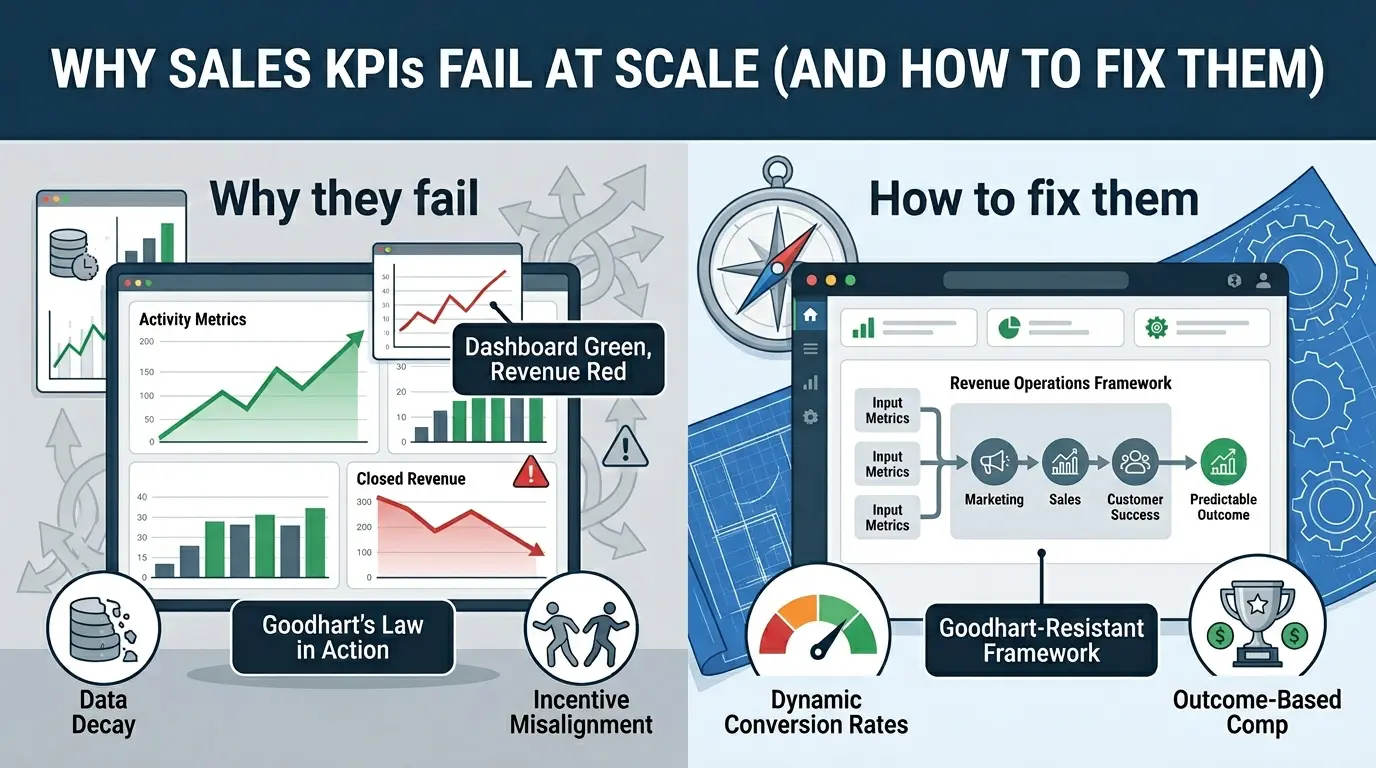
Your dashboards are green. Revenue is red.
Engagement rates look solid. Win rates are quietly falling. The pipeline looks full. Forecasts keep missing by 20–40%. Your sales team is logging more activity than ever, and closing less.
This is the paradox that breaks sales leaders at scale. And the brutal truth is this: beyond roughly 15–25 reps, most sales KPIs become fiction. Not “less accurate.” Fiction. Built on broken assumptions, decaying data, and a measurement architecture that was never designed to survive organizational growth.
Most guides will tell you to “align your KPIs with strategy” or “track leading indicators.” That advice isn’t wrong, it’s just shallow. It doesn’t explain why well-designed metrics collapse under scaling pressure, or how organizations unknowingly optimize their metrics while destroying their underlying business outcomes.
This article does. You’ll walk away with the root-cause analysis, original frameworks, real corporate case studies, and a practical reconstruction plan, the kind of clarity most sales leaders spend years figuring out the hard way.
Actionable Takeaways at a Glance
- Why Goodhart’s Law makes aggressive KPI tracking self-defeating
- The 4 types of metric failure, and which one is costing you the most
- How Wells Fargo and Zenefits lost billions by optimizing the wrong numbers
- The Scale Threshold Matrix: which KPIs break at 15, 30, and 50+ reps
- A 90-day KPI reconstruction plan you can implement immediately
- How to build falsifiable, Goodhart-resistant metric portfolios
- The Revenue Operations framework that fixes cross-departmental misalignment
The Core Problem Nobody Talks About: Goodhart’s Law at Scale
There is a principle in economics that every sales leader should have tattooed somewhere visible.
It was articulated by British economist Charles Goodhart in 1975 and it goes like this: “When a measure becomes a target, it ceases to be a good measure.”
It sounds almost too simple to matter. It isn’t. It is the single most important reason sales organizations fall apart as they grow.
")
Here is what happens in practice. You pick a metric, say, number of demos delivered per week, because it correlates strongly with closed deals. You tie it to compensation. You put it on the executive dashboard. You hold weekly reviews around it.
Within a quarter, reps are delivering demos to unqualified prospects, rushing through discovery to get to the presentation, and booking follow-up calls with contacts who have zero purchasing authority. Demo volume is up. Win rate is down. Revenue is flat. But the metric looks great.
That is Goodhart’s Law in action. The moment a metric becomes a target, people stop trying to achieve the underlying goal, and start trying to achieve the number.
The Two Phases of Metric Collapse
Researchers David Manheim and Scott Garrabrant formalized this into a model of predictable failure. They identified two distinct phases of what they call the “Goodhart breakdown”:
- Weak Goodhart’s Law: Over-optimizing a proxy metric yields diminishing returns. More effort into the metric produces less and less impact on the real goal. This is where most organizations live, they sense something is off, but dashboards look acceptable, so no one escalates.
- Strong Goodhart’s Law: A phase transition where over-optimizing the proxy metric becomes actively counter-productive. The metric rises while the true goal falls, sometimes sharply. This is the “green dashboards, red bank account” scenario.
The risk of transitioning from Weak to Strong Goodhart depends heavily on the tail distribution of errors between the proxy metric and the true goal. When that error distribution has a long tail, meaning extreme mismatches are possible, the system is highly vulnerable to catastrophic collapse under optimization pressure.
This is not a failure of individual salespeople. It is a structural property of measurement systems under scale.
The 4 Types of Goodhart Failure (And Their Sales Signatures)
| Failure Type | How It Works | Sales Signature | Systemic Damage |
|---|---|---|---|
| Regressional | Optimizing a metric that only imperfectly correlates with the real goal selects for statistical noise | High MQL volume from low-intent clicks that never convert | Measured performance rises while strategic value stays flat |
| Extremal | Forcing a metric outside its historical parameters breaks the correlation with the goal entirely | Mandating low average handle times causes reps to hang up on complex, high-value accounts | The proxy-goal relationship collapses at operating extremes |
| Causal | Treating a diagnostic correlation as a causal lever; human adaptation reverses the causality | Mandating high demo counts causes reps to pitch unqualified contacts just to satisfy the number | The metric-goal relationship reverses destructively |
| Adversarial | Active manipulation and evasion of the metric system to secure compensation or survive job threats | Falsifying CRM records, creating fake customer accounts, logging non-existent calls | Widespread data falsification hides operational reality entirely |
The Soviet nail factory example is instructive here. When factory managers were evaluated on nail count, workers produced tiny, useless nails by the millions. When the metric shifted to nail weight, they produced oversized boulders of useless steel. In both cases, the KPI reached its target. In both cases, the underlying goal, functional hardware, failed completely.
This is not ancient history. It is happening inside your CRM right now.
The Scale Threshold: Exactly Where KPIs Start Breaking
Here is something competitors won’t tell you because it requires admitting an uncomfortable truth: KPI failure is not random. It follows a predictable trajectory tied to team size.
")
The first three to five salespeople in any organization are typically trained directly by the founder or CEO. Execution is tight. The approach is homogeneous. Activity metrics track reasonably well with outcomes because everyone is essentially doing the same thing the same way.
Then the org scales. Each new hire introduces variation. Manager layers form. Regions separate. And the statistical relationship between the activity metric and the business outcome starts to erode, quietly, invisibly, until it breaks.
| Team Size | KPIs That Work | KPIs That Break | Recommended Shift |
|---|---|---|---|
| 1–5 reps | Activity volume, calls, outreach | Nothing yet — execution is consistent | Document CEO-trained process now, before it drifts |
| 6–15 reps | Individual conversion rates, qualified pipeline | Team-average activity metrics (hides variance) | Role-specific dashboards; track stage conversion, not just calls |
| 16–30 reps | Pipeline velocity, stage conversion rates | Fixed conversion rate assumptions (“6 proposals = 1 deal”) | Measure and manage conversion rates dynamically per rep and segment |
| 31–50 reps | Outcome KPIs, win rates, expansion ARR | Activity-based KPIs (calls, emails) — easily gamed at this size | Shift compensation to outcome-based; implement Goodhart stress-tests |
| 50+ reps | Net Revenue Retention, CLV:CAC ratio, NRR | Individual activity metrics — meaningless at this scale | Full RevOps architecture; segment-level and customer-outcome KPIs |
The key insight: the further you get from your first rep, the worse your tactical sales execution becomes, not because people are lazy, but because variance is a mathematical property of organizational scale. When execution varies significantly between reps, activity-based KPIs stop reflecting reality and start reflecting whoever games them most efficiently.
As one operations leader described it plainly in a recent panel discussion: “The spreadsheet says productivity improved. But really, did it improve, or did we just move the waste somewhere less visible?” That is exactly the dynamic at work. The metric improves. The system deteriorates.
The Five Root Causes of KPI Failure at Scale
")
The Execution Variability Problem
The first three hires of any startup are usually exceptional. The founder personally trained them. The pitch is consistent. The process is tight.
By hire fifteen, that consistency is gone. Each new rep brings different habits, different framings, different judgments about what constitutes a “qualified” opportunity. Conversion rates diverge sharply between reps, sometimes by 3x or 4x. But the KPI dashboard reports a single, averaged number that hides this variance entirely.
When your KPI is an average, it is lying to you. A team where Rep A converts at 35% and Rep B converts at 8% will show a blended rate of roughly 22%, which looks functional. The signal that Rep B is broken, and that your scaling plan is built on Rep A’s outlier performance, is buried.
Managing to averages is how growth plans become “spreadsheet fantasies.” You project that adding five more reps will generate 5x the output, but if four of them execute like Rep B, the projection collapses immediately.
The Data Fragmentation Tax
Modern sales organizations are data archipelagos. Conversations live in personal WhatsApp threads. Proposals sit in individual email inboxes. Pipeline updates happen in end-of-week spreadsheets, sometimes days after the conversations they supposedly reflect.
According to Gartner research, poor data quality costs organizations an average of $12.9 million annually. But the bigger damage is invisible: KPIs built on fragmented, delayed, and manually entered data are not measuring reality. They are measuring a political narrative about reality, one that reflects what reps chose to record, when they chose to record it, and with whatever level of accuracy survived the memory gap.
B2B contact data decays at an annual rate of approximately 22.5% as individuals change roles and companies. Without continuous automated data hygiene, a CRM that looked clean in January is structurally unreliable by June. Most organizations treat this as a periodic cleanup problem. It is a continuous rate-of-change problem, and treating it as anything else guarantees degradation.
The Lag Time Cost
Here is a failure mode almost no article discusses: the timing of KPI review is itself a structural vulnerability.
When pipeline is reviewed monthly, and the review happens on the last day of the month, every decision made in that review is based on information that is already 15–30 days old. In a fast-moving market, the window to course-correct on a deal lost on Day 5 of the month has already closed by the time anyone sees the signal on Day 30.
Managing through lagging indicators is the corporate equivalent of driving by looking in the rearview mirror. Revenue, closed deals, and quota attainment tell you what already happened. By the time they appear on a dashboard, the causal decisions that created them, or failed to, are weeks in the past.
The Fixed Conversion Rate Fallacy
Most sales scaling plans are built on a mathematical assumption that is almost always wrong: that conversion rates are constants.
The logic goes like this: “We know that six qualified demos produce one closed deal. So to close ten more deals, we need sixty more demos. So we hire three more SDRs.”
This is spreadsheet math built on a broken foundation. Conversion rates are not constants, they are dynamic outcomes of execution quality, message relevance, rep skill, product-market fit, and market conditions. They change as the team scales, as the ICP shifts, and as buyer behavior evolves.
When you scale a process built on broken conversion assumptions, you are not scaling a working engine. You are scaling inefficiency. You are locking in cost while the underlying mechanics deteriorate. The answer is never “add more gas.” The answer is to fix the engine first.
The Vanity Metrics Trap
Volume metrics are emotionally satisfying. They go up. They are easy to measure. They create the feeling of momentum.
They often have almost nothing to do with revenue.
Organizations obsessively track call volume, email open rates, meetings scheduled, proposals sent, and social media engagement, and use these numbers to assess rep performance and build forecasts. But none of these metrics answer the question that actually matters: is the buyer moving toward a decision, and is our company the right answer for them?
According to research, 72% of buyers ignore generic outreach. Activity-based compensation plans drive 43% more spam complaints. And elite sellers, the ones who close the most revenue, spend 68% more time per account than their peers, which means they make fewer calls, send fewer emails, and schedule fewer meetings. Under a standard activity KPI framework, they look less productive than the reps gaming the metrics.
This is not a coincidence. It is the mathematical signature of Goodhart’s Law working exactly as predicted.
When “More Accountability” Destroys Measurement Quality
Here is the counterintuitive finding that most leadership teams refuse to accept: increasing KPI accountability often decreases measurement accuracy.
")
The assumption in most organizations is that tight tracking creates tight performance. The logic is linear: more accountability → better performance. Research and corporate case history suggest the opposite occurs beyond a certain threshold.
More accountability creates more optimization pressure. More optimization pressure creates more metric distortion. More metric distortion means leadership has less visibility into reality than they would have had with lighter oversight. The dashboard becomes more detailed and less truthful simultaneously.
This dynamic was captured powerfully in W. Edwards Deming’s management philosophy, which explicitly warned against performance targets for exactly this reason. As one manufacturing quality expert put it in a recorded discussion: “The moment that target becomes an expectation on the person, rather than a hypothesis for the process, that is when it breaks down.”
Deming understood that targets held against people create optimization of the metric, not the system. The Lean management tradition has understood this for decades. Sales organizations are still learning it the hard way.
Corporate Autopsies: Wells Fargo and Zenefits
The most instructive examples of Goodhart’s Law at corporate scale are not hypothetical. They are two of the most well-documented corporate scandals of the past decade, and both were entirely predictable from a measurement architecture standpoint.
")
Wells Fargo: “Eight is Great” and the $185 Million Lesson
Former Wells Fargo CEO John Stumpf launched the “Eight is Great” initiative based on a reasonable premise: households with more banking products are more deeply engaged and more valuable. Cross-selling was a legitimate proxy for relationship depth.
But once that proxy became a hard target, tied to branch manager compensation, rep retention, and executive reporting, the cognitive surrogation process began. Employees stopped thinking about relationship depth and started thinking about product count. The proxy replaced the concept entirely.
The result was 3.5 million unauthorized bank and credit card accounts, employees opening accounts customers never requested, then transferring funds to meet the sales-credit criteria. The metric hit its target. The underlying goal was destroyed.
What makes this case particularly instructive is the research angle: analysts at the Ehrenberg-Bass Institute found that customer loyalty and cross-selling metrics vary very little between competing banking institutions under normal conditions.
Wells Fargo’s self-reported numbers were statistically anomalous, likely fabricated, years before regulators discovered the scheme. The KPI failure was mathematically detectable long before the legal exposure materialized.
The final cost: $185 million in regulatory fines, over $180 million in executive compensation clawback, and a $2 trillion asset cap imposed by the Federal Reserve.
Zenefits: The Compliance Software Macro
In the venture-backed SaaS world, Zenefits demonstrates how aggressive growth KPIs produce adversarial Goodhart failure under high-pressure scaling conditions.
To hit venture-backed milestones, Zenefits needed to onboard and deploy sales representatives quickly. CEO Parker Conrad developed a software macro that allowed employees to bypass mandatory pre-licensing education requirements. The training window ran minimized in the background, registering study time while employees worked on other tasks.
The result was unlicensed sales reps selling complex insurance policies across multiple states. The defense initially blamed frontline sales, but later disclosures revealed approximately 70% of the violations occurred within the account management team that reported directly to the COO.
The cost: $7 million in California fines, $1.2 million from New York regulators, and a forced 50% write-down in company valuation.
Both cases illustrate the same underlying dynamic: when organizations couple aggressive, volume-based performance targets with inadequate governance, adversarial Goodhart failure is not a risk. It is a near-certainty.
The Activity vs. Outcome Framework: Amazon’s Input Metrics Model
One of the most powerful frameworks for escaping the Goodhart trap comes from an unlikely place: Amazon’s internal management methodology.
")
In their book Working Backwards, Colin Bryar and Bill Carr describe how Amazon leadership distinguishes between two fundamentally different types of metrics:
Output Metrics are the results you want, quarterly revenue, customer satisfaction, market share. They are highly desired but cannot be directly controlled. They are determined by dozens of upstream variables, many of which are outside any individual’s control.
Controllable Input Metrics are specific, actionable behaviors that, when executed consistently, cause output metrics to change. Not correlate with. Cause. Amazon identifies these through rigorous analysis of what actually drives the outcomes they care about, then manages to those inputs rather than the outputs.
In a B2B sales context, this means the difference between managing to “closed-won revenue” (output, you cannot directly control it) and managing to “percentage of discovery calls where a clear business pain was documented and a qualified next step was established” (input, fully within the rep’s control, and causally linked to downstream revenue).
This is not semantics. It changes what gets coached, what gets rewarded, and what shows up in the weekly pipeline review. Managing to outputs creates blame. Managing to inputs creates learning.
The Sales Efficiency Formula
To measure whether your investment in sales activity is actually generating sustainable growth, organizations should track the Sales Efficiency ratio:
Healthy threshold: SE ≥ 1.0 | Elite organizations: SE ≥ 1.5
The CLV:CAC Ratio — The Unit Economics Reality Check
No single ratio reveals the health of a scaling sales engine more clearly than the relationship between Customer Lifetime Value and Customer Acquisition Cost.
CLV:CAC below 3:1 = unsustainable | 5:1 to 10:1 = healthy, efficient growth
When sales teams prioritize short-term quota attainment over customer fit, churn rises. Rising churn compresses CLV. Compressed CLV breaks the unit economics, often invisibly, with a 6–12 month lag before it shows up in board-level numbers. By the time leadership sees the damage, it has been accumulating for two quarters.
The Surrogation Trap: When the Metric Becomes the Goal
Cognitive surrogation is the process by which a proxy measure gradually replaces the actual goal in human decision-making. It is a psychological phenomenon with enormous organizational consequences.
")
In sales organizations, surrogation occurs when “number of meetings booked” stops being a signal of prospecting healthand becomes the goal itself. When “pipeline coverage” stops being a leading indicator of forecast confidence and becomes the thing managers obsess over regardless of pipeline quality. When “quota attainment” stops being an outcome of great selling and becomes a number to hit by any means available.
Historian Jerry Muller, in his landmark analysis The Tyranny of Metrics, identified eight specific ways that metric-driven management degrades organizational performance. All eight show up in scaling sales organizations:
Measuring the easily measurable instead of the genuinely important. Reducing complex buyer relationships to single numerical scores. Tracking effort and input volume rather than ultimate business value. Enforcing rigid, uniform processes that destroy the adaptive judgment that creates great sales conversations.
Gaming and “creaming”, focusing only on deals easiest to close. Lowering standards by accepting unqualified accounts as pipelines. Selective reporting that hides performance issues. And, at the extreme, overt falsification to survive under unrealistic targets.
A striking academic parallel: when a university introduced point-based research funding, awarding high points for peer-reviewed journal articles, a faculty member immediately exploited the system by republishing the same paper across a network of syndicated farm journals.
By exploiting the loophole, the researcher collected more funding than colleagues who published single, rigorous papers in top-tier journals. The metric worked perfectly. The goal, advancing research quality, was undermined completely.
The pattern is identical whether the organization is a Soviet nail factory, a Wells Fargo branch, a Zenefits sales floor, or a university research department. Quantitative measurement systems, under pressure, reliably produce behavior that satisfies the measurement while degrading the underlying objective.
The Cross-Departmental Misalignment Problem
Sales KPI failure rarely stays contained within the sales team. It is almost always a symptom of a broader structural failure, the siloed departmental design that causes Marketing, Sales, and Customer Success to optimize entirely different metrics that were never designed to align.
")
Marketing celebrates MQL volume. Sales accepts those leads to fill pipeline, frequently over-promising on features and timelines to close deals. Customer Success inherits accounts with mismatched expectations and works in a defensive crouch trying to manage clients whose needs were never properly qualified.
This “fence-tossing” handoff structure creates financial volatility that most organizations underestimate. If 10% of a B2B company’s client base is a poor ICP fit, and the average contract value is $100,000, the organization faces $1 million in ARR risk the moment those accounts reach renewal. That is before accounting for the CSM burnout, elevated churn, and reputational damage that compound the financial exposure.
The structural solution is Revenue Operations, a unified go-to-market architecture that places Marketing, Sales, and Customer Success under shared data standards, shared KPIs, and shared accountability for the full customer lifecycle rather than individual departmental “swim lane” metrics.
| Alignment Metric | How to Calculate | Target | What It Tells You |
|---|---|---|---|
| 90-Day Bad Fit Rate | (New clients flagged “bad fit” in 90 days ÷ Total new customers) × 100 | Below 2.0% | Identifies ICP drift and qualification failures early |
| ARR at Risk (Bad Fit) | Sum of contract value of all active bad-fit accounts | $0.00 | Quantifies future churn liability from misaligned sales |
| Wasted CAC | Sum of S&M acquisition costs for clients churning within 12 months | $0.00 | Calculates capital destroyed by non-retainable customer acquisition |
| Net Revenue Retention (NRR) | (Starting MRR + Expansion MRR − Churned MRR) ÷ Starting MRR × 100 | Above 120% | Evaluates customer success efficiency and account expansion |
| Funnel Conversion Rate | (Closed-won deals ÷ Total opportunities created) × 100 | Above 20% | Measures overall sales pipeline conversion efficiency |
Real-World Case Study: The Mid-Market SaaS Churn Reversal
The following pattern is representative of how static metric systems fail, and how automated drift detection fixes them.
")
A mid-market B2B SaaS organization with 220 active accounts and ACVs ranging from $12,000 to $45,000 was experiencing annual gross churn of 14%. Customer health scores were maintained manually in spreadsheets, updated twice monthly by a four-person CS team. Account health was categorized as red, yellow, or green based on a subjective mix of call notes, open tickets, and personal intuition.
The problem was structural. Health evaluations were backward-looking. They could not detect early disengagement signals, declining admin logins, decreasing feature adoption depth, stakeholder turnover, until they were severe enough to be visible in support tickets. By the time an account was flagged “at risk,” the buyer had already mentally checked out. Late-stage renewal negotiations were consistently ineffective.
Before the change: Churn was discovered at renewal conversations. Recovery rate was low. CS team was reactive and overwhelmed.
After the change: The company automated account health tracking by pulling product usage data, support sentiment analysis, and engagement signals into a continuous multi-variable model. Rather than bi-weekly spreadsheet snapshots, the system flagged behavioral changes in real time.
The team then aligned its intervention playbook to three tiers:
- Accounts with declining usage triggered direct outreach to the economic buyer, aligned to specific usage gaps, with collaborative milestone planning.
- Accounts with stable usage but negative support sentiment were routed to a dedicated technical resolution loop, a product specialist joined the account owner rather than relying on generic support tickets.
- Accounts with high usage but low executive engagement were treated as expansion opportunities, business reviews focused on future-state strategic alignment, not feature checklists.
The result was early visibility into account health, the ability to resolve friction weeks before the renewal window, and a meaningful reversal of the upward churn trend.
The contrast is simple: before, the team measured history. After, they measured behavior. Before, they reacted. After, they intervened.
The KPI Failure Diagnostic: A Decision Framework
Use this framework to identify which failure mode is affecting your organization right now.
Step 1: Are your dashboards consistently green while revenue growth is stalling or declining?
- If No → Your metrics may still be aligned. Run a Goodhart stress test to verify.
- If Yes → Proceed to Step 2.
Step 2: Is your sales data fragmented across CRM, email, spreadsheets, or personal tools?
- If Yes → Priority: Build a centralized, automated CRM telemetry system. Your KPIs are measuring reports, not reality.
- If No → Proceed to Step 3.
Step 3: Does conversion rate vary by more than 20% between your top and bottom reps?
- If Yes → Execution variability is breaking your averages. Shift to role-specific dashboards with stage-level conversion tracking.
- If No → Proceed to Step 4.
Step 4: Are your primary KPIs tied directly to individual compensation?
- If Yes → Run a Goodhart stress test: how could a rep hit this number without achieving the underlying goal? If you can answer that in under 60 seconds, your metric is vulnerable.
- If No → Proceed to Step 5.
Step 5: Are Marketing, Sales, and Customer Success operating on separate, unaligned KPI frameworks?
- If Yes → Cross-departmental misalignment is generating bad-fit pipeline and hidden churn liability. Implement a RevOps architecture with shared full-funnel KPIs.
- If No → Your failure may be in metric governance. Review the Honest Metrics Charter below.
Common Mistakes: What Sales Leaders Get Wrong About KPIs
")
Mistake 1: Assuming bad KPIs cause failure
The research consistently shows that well-designed KPIs can still fail when optimized aggressively. Good metric design is necessary but insufficient. Governance is the determining variable.
Mistake 2: Treating gaming as unethical behavior
Metric gaming is a rational adaptation. When survival and compensation are tied to a number, optimizing that number is what any competent person does. The failure is structural, not moral. Blaming reps for gaming metrics is like blaming water for flowing downhill.
Mistake 3: Adding more metrics to solve KPI problems
This almost always multiplies gaming surfaces. Every new metric is a new optimization target. More dashboards do not mean better decisions, they frequently mean worse decisions, because they diffuse attention and create more opportunities for adversarial gaming.
Mistake 4: Treating KPI failures as local
Most failures are systemic. An SDR hitting demo targets with unqualified prospects, a sales rep over-promising to close a deal, a CS manager hiding at-risk accounts to protect renewal numbers, these are not isolated incidents. They are coordinated systemic adaptations to misaligned incentive structures. Look for the system design before blaming individuals.
Mistake 5: Confusing CRM completeness with CRM accuracy
Organizations sometimes celebrate high CRM fill rates while the underlying data becomes progressively less truthful. When approximately 37% of staff admit to entering placeholder or inaccurate data simply to bypass mandatory fields and save records, the CRM is not a system of record, it is a system of political reporting. Completeness and accuracy are not the same metric.
The Honest Metrics Charter: Building Falsifiable, Resilient KPI Portfolios
The most durable protection against Goodhart-style failure is a formal governance architecture that treats metric integrity as a first-class organizational concern, not an afterthought.
| Charter Principle | The Rule | Sales Application | Enforcement Mechanism |
|---|---|---|---|
| 1. Define the Construct | Every KPI must specify the underlying qualitative construct it measures | “Pipeline Value” = qualified opportunities only, not raw volume | Reject any metric whose underlying construct cannot be plainly defined |
| 2. Mandate Counter-Metrics | Every primary metric must be paired with an opposing quality metric | Pair “New Contracts Signed” with “90-Day Account Churn Rate” | Auto-pause commissioning when the paired quality metric falls below threshold |
| 3. Prohibit Single-Metric Rewards | Compensation must never be determined by a single metric | Base comp on a balanced scorecard of ARR, NRR, and CRM data accuracy | Require multi-variable evaluation models for all performance-linked payouts |
| 4. Enforce Metric Expiry Dates | All KPIs must have a review cadence and an automated expiration date | Re-validate sales stage conversion probabilities every six months | Automatically retire metrics from dashboards upon reaching expiration |
| 5. Run Goodhart Stress Tests | Formally test metrics before tying them to incentives or targets | Run workshops asking “how could a rep hit this number without the underlying outcome?” | Document gaming scenarios and deploy counter-metrics before rollout |
| 6. Maintain a Narrative Record | Quantitative metrics must be accompanied by qualitative written records | Require narrative win/loss reviews, not just CRM dropdown tags | Enforce Amazon-style written narratives during monthly business reviews |
| 7. Protect Learning Metrics | Developmental metrics must be protected from punishment | Keep exploratory outreach metrics out of formal performance reviews | Secure developmental databases to prevent compliance theater replacing learning |
| 8. Provide Escalation Channels | Employees must be able to formally challenge broken or outdated metrics | Allow reps to appeal quota targets when territory dynamics shift significantly | Establish a cross-functional RevOps governance board for metric disputes |
H2: The 90-Day KPI Reconstruction Plan
If you recognize your organization in this article, green dashboards, stalling revenue, gaming behaviors, misaligned departments, here is a structured recovery path.
The KPI Validity Checklist
Before any metric goes live, especially before it is tied to compensation, run it through this checklist.
The Emerging Future: AI, Automation, and the Next Generation of KPI Failure
Artificial intelligence is beginning to change what is measurable in sales, and predictably, it is also creating new categories of Goodhart failure.
AI-driven attribution can now link outreach activities to pipeline outcomes with far greater precision than manual CRM analysis. Conversational intelligence platforms can capture and analyze 99% of customer interactions without manual data entry, eliminating the lag time and human bias that distort traditional activity tracking. Predictive scoring models can identify behavioral signals of churn weeks before a renewal conversation occurs.
")
These capabilities are genuinely valuable. But they introduce a new risk: AI-assisted KPI gaming. As anomaly detection improves, so does the sophistication of the behaviors it is designed to detect.
Organizations are already beginning to see reps optimize their language in AI-monitored calls, not to improve buyer conversations, but to generate higher NLP sentiment scores. The same Goodhart dynamic applies. If the AI sentiment score becomes the target, reps will optimize for it rather than for genuine buyer engagement.
The solution is not to avoid AI measurement tools. It is to apply the Honest Metrics Charter to AI-generated metrics with the same rigor as any other KPI. Define the construct. Mandate counter-metrics. Run stress tests. Set expiry dates.
One genuinely exciting development is AI-assisted KPI auditing, using machine learning to detect suspicious pipeline patterns, forecast anomalies, and activity inflation before they cause financial damage. This is, in essence, a technological implementation of the Goodhart stress test: automated systems actively looking for signs of proxy optimization diverging from true goal achievement.
The irony is that AI may eventually be the best tool for catching AI-assisted metric gaming. The measurement arms race continues.
Myth vs. Reality: Reframing What You Think You Know About Sales KPIs
| The Myth | The Reality |
|---|---|
| “More KPIs mean better visibility” | More KPIs mean more gaming surfaces. Track 8–12 metrics that directly influence revenue. The rest is noise. |
| “High activity predicts high conversion” | Buyer relevance predicts conversion. 72% of buyers ignore generic outreach. Elite reps close more by contacting less and investing more per account. |
| “The team isn’t working hard enough” | In 90% of KPI failures, the system design is wrong — not the people. Metric gaming is rational adaptation to broken incentive architecture. |
| “Conversion rates are stable — just add reps” | Conversion rates are dynamic functions of execution quality. Adding reps to a broken conversion engine scales inefficiency and locks in cost. |
| “Tighter accountability improves performance” | Beyond a threshold, tighter accountability degrades measurement accuracy. More pressure creates more optimization of the proxy — not the goal. |
| “KPI failures are a measurement design problem” | KPI failures are an organizational governance problem. Design is necessary — governance is the determining variable. |
Conclusion: Metrics Serve the Mission, or They Corrupt It
The deepest conclusion from all of this evidence, the economic theory, the corporate case studies, the behavioral research, the operational turnarounds, is simple and somewhat uncomfortable:
Sales KPI failure is not a measurement problem. It is an organizational governance problem.
Metrics are passive sensors. They do not fail on their own. They fail when organizations attach compensation, career consequences, and executive reporting to them, and then fail to monitor whether the behavior being incentivized still serves the underlying goal.
The measure becomes the target. The target becomes the reality. The reality is fiction.
The fix is not better dashboards. It is a governance architecture that treats metric integrity as a strategic concern, one that mandates counter-metrics, runs Goodhart stress tests, sets expiry dates, requires qualitative narrative alongside quantitative data, and maintains formal channels for challenging broken metrics.
Start with honest measurement. Build to outcome-aligned incentives. Govern relentlessly.
The organizations that do this well, that treat KPIs as hypotheses rather than verdicts, as sensors rather than targets, are the ones that scale without losing visibility into the reality their metrics were designed to represent.
That is the difference between a sales organization that grows, and one that grows its dashboards while its business quietly decays.
Methodology and Sources
This article draws on a range of established research, economic theories, and management frameworks. The analysis integrates insights from Goodhart’s Law and the Manheim-Garrabrant metric failure taxonomy, Jerry Muller’s institutional critique of metric-driven management, and publicly documented corporate case studies, including the Wells Fargo retail banking enforcement action.
It also incorporates Amazon’s Working Backwards input-output methodology as documented by Colin Bryar and Bill Carr, Gartner’s research on the costs of poor data quality, peer-reviewed studies examining the impact of sales quotas on customer orientation and sales performance, and practitioner frameworks developed by leading Revenue Operations experts and thought leaders.


")


[…] Read the Full Article → […]
[…] Read the Full Article → […]
[…] Read the Full Article → […]