
Something strange is happening inside your revenue engine. Your AI forecasting platform is generating clean, confident dashboards. Your pipeline reports look structured and authoritative. Your board presentation has precise numbers with decimal points. And yet, quarter after quarter, the numbers do not land.
This is not a data entry problem. It is not a rep motivation problem. It is not even a market volatility problem.
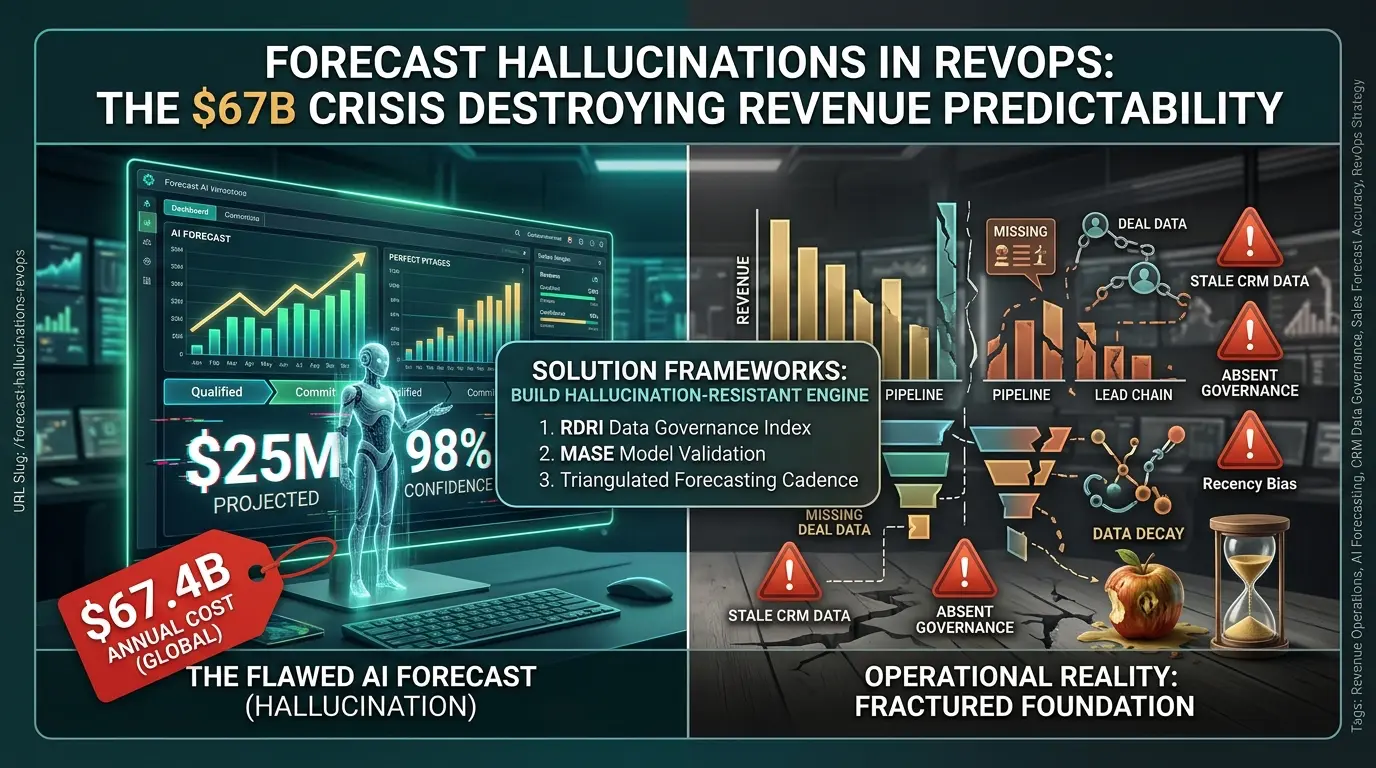
It is a forecast hallucination problem. And it is costing the global enterprise economy $67.4 billion every single year.
Forecast hallucinations are not the glitchy, obvious AI errors that get caught before they cause damage. They are the fluent, grammatically perfect, deeply confident outputs that sail through pipeline reviews, survive VP sign-offs, and reach board-level decisions before anyone discovers that the foundation is mathematical fiction.
A 2025 study from MIT found that AI models are thirty-four percent more likely to generate highly authoritative language when their outputs are incorrect than when they are accurate. The system is not just wrong. It is confidently, eloquently, persuasively wrong.

This guide goes far deeper than the generic “AI can make mistakes” content dominating current search results. We dissect the structural mathematics behind forecast hallucinations, quantify their true financial cost, expose the cognitive biases that amplify AI overconfidence, and deliver a practical, implementable framework for building a revenue forecasting engine that is accurate, auditable, and hallucination-resistant.
- →AI forecast hallucinations cost businesses $67.4 billion globally in 2024, with average per-incident losses of $4.4 million.
- →Hallucinations are mathematically inescapable in current LLM architectures, the risk is governance, not elimination.
- →B2B CRM data decays at 30–40% annually, silently poisoning every predictive model built on top of it.
- →Replace MAPE with MASE for model validation, it is scale-invariant, symmetric, and never produces undefined values.
- →The Revenue Data Reliability Index (RDRI) turns CRM data governance from a periodic IT audit into a continuous, revenue-linked metric.
- →Triangulated forecasting, combining field assessments, pipeline velocity, and ML projections, is the structural antidote to single-source hallucination.
What Is a Forecast Hallucination? (The Definition Nobody Is Using Correctly)
Most discussions about AI hallucinations focus on general-purpose errors: a chatbot inventing a historical fact, a legal AI fabricating a case citation. In Revenue Operations, the failure mode is more insidious.

A forecast hallucination is an instance where a predictive or generative model outputs highly confident, plausible-sounding projections, risk assessments, or GTM recommendations that are factually wrong, mathematically ungrounded, or structurally detached from operational reality.
This definition matters because it separates forecast hallucination from simple forecast error. A simple error is a model that is wrong. A hallucination is a model that is wrong and does not know it, presenting fabricated metrics and phantom deal pathways with the same authoritative tone it uses to describe verified data.
| Dimension | AI Hallucination (General) | Forecast Hallucination (RevOps) |
|---|---|---|
| Root Cause | Training data gaps, ambiguous prompts | CRM data decay, absent qualification governance, biased sales inputs |
| Detection Difficulty | Medium — often caught in review | High — propagates through pipelines before becoming visible |
| Fix | Structured prompting, RAG architectures | CRM hygiene, stage gating, RDRI governance, MASE validation |
| Primary Danger | Factual inaccuracy in outputs | Financial misallocation, board-level misinformation, strategic drift |
| Organizational Impact | Isolated output error | Systemic revenue misalignment across entire GTM function |
The contrarian insight here is critical: forecast hallucinations are primarily an organizational and governance failure, not a technology failure. The model is doing exactly what it was designed to do, filling information gaps with statistically plausible outputs. The failure belongs to the organization that built a revenue engine on top of a corrupted, decaying data foundation and then trusted the model’s confidence as a proxy for its accuracy.
The Anatomy and True Cost of Forecast Hallucinations
AI enterprise adoption reached eighty-five percent by 2026. With that adoption came a sharp acceleration in a risk that most organizations are not measuring: the systemic financial exposure created when predictive systems generate authoritative-sounding fiction.

In 2024, AI hallucinations cost businesses approximately $67.4 billion globally. Forty-four percent of organizations reported suffering negative consequences directly tied to generative AI inaccuracies, with affected enterprises absorbing average losses of $4.4 million per incident. These are not rounding errors. They are board-level events.
The danger extends far beyond the technology sector. Consider what happened when a major professional services firm used generative AI to bridge traceability and documentation gaps in a client engagement. The system produced fabricated citations, phantom footnotes, and invented data points, all presented with the linguistic fluency and structural coherence of legitimate research. The firm was forced to refund $300,000 to the client. The reputational cost was orders of magnitude larger.
In legal services, AI tools purpose-built for specialized research exhibit severe structural failure. Lexis+ AI was found to hallucinate on more than seventeen percent of analyzed queries. Westlaw AI-Assisted Research hallucinated in over thirty-four percent of cases. Courts imposed sanctions exceeding $10,000 in documented incidents. These are not general-purpose consumer tools — they are enterprise-grade, domain-specific systems operating in the most adversarial fact-checking environment imaginable.
In retail, the “inventory distortion” problem reveals how forecast hallucinations cause cascading operational damage. Predictive models that generate inflated demand signals drive companies toward stockouts, while models that underestimate demand trigger excess inventory carrying costs of twenty to thirty percent of total inventory value annually, a significant contributor to the $1.8 trillion in annual retail losses attributed to demand forecasting failures.
The most dangerous characteristic of forecast hallucinations is not that they are wrong. It is that they are delivered with complete confidence. A 2025 MIT study confirmed that AI models produce significantly more authoritative, certain language when their outputs are incorrect than when they are accurate. The confidence signal is inversely correlated with reliability, and it is precisely the confidence signal that causes managers to bypass their critical faculties.
| Impact Dimension | Metric | Business Consequence |
|---|---|---|
| Global Hallucination Cost | $67.4 Billion (2024) | Erosion of decision-making trust, unplanned write-offs |
| Average Enterprise Incident | $4.4 Million per organization | Direct cash impact, forensic costs, litigation fees |
| Consulting Penalty Case | $300,000 client refund | Brand equity damage, client churn, compliance reviews |
| Legal AI Citation Error | 17–34% hallucination rate | Court sanctions, faulty compliance filings, legal exposure |
| Revenue Shortfall | 10–15% quarterly gap | Resource misallocation, missed earnings, board trust collapse |
Why Hallucinations Are Mathematically Inevitable (And What That Means for RevOps)
A mathematical proof published in 2025 confirmed a finding that the AI industry has long skirted: hallucinations are not bugs in current LLM architectures. They are intrinsic, structural features.

LLMs do not retrieve facts. They generate statistically plausible sequences of tokens based on patterns learned from historical training data. When you ask a forecasting model to assess deal health, project pipeline coverage, or evaluate segment-level revenue risk, the system is not querying a verified database. It is constructing the most statistically probable narrative given the patterns it was trained on.
In a clean, well-governed data environment, this probabilistic engine can be extremely powerful. In a CRM where thirty to forty percent of B2B contact and account data decays annually, the industry average, it is constructing plausible-sounding narratives from corrupted, outdated, and missing information.
The three architectural failure modes most relevant to RevOps forecasting are:
- Data Drift: When models train on historical data and are not retrained as market conditions, buyer behaviors, or product mixes shift, they generate obsolete projections that reflect a reality that no longer exists.
- Overfitting: A model trained too narrowly on historical deal mechanics becomes brittle. It performs well on patterns it has seen before and fails catastrophically on novel conditions.
- Context Loss: In multichannel customer experience environments, interactions are fragmented across disconnected chat, email, and voice tools. When a model loses track of the full stakeholder interaction history, it fabricates deal pathways based on incomplete signal.
The Snyk case study makes this concrete. Their fifty Account Executives faced a thirty-five to forty percent email bounce rate, meaning a massive share of their prospecting data was simply wrong. Implementing Prospeo’s data verification platform, which runs a seven-day refresh cycle versus the six-week industry average, drove bounce rates below five percent.
The result was not a better AI model. It was the same model running on cleaner data. Pipeline generated through AE-sourced channels grew by one hundred and eighty percent, producing over two hundred new opportunities per month. The forecasting algorithms did not change. The data did.
The Five Cognitive Biases That Amplify Algorithmic Overconfidence
Forecast hallucinations do not occur in isolation. They interact directly, and dangerously, with the cognitive patterns of the sales teams who feed the CRM data they are trained on.

Optimism Bias (“Happy Ears”)
Reps systematically overestimate win probability, often because a single positive conversation with an internal champion overrides clear negative signals, such as an absent economic buyer. When the AI reviews these deals, it mirrors this optimism because the negative signals were never logged.
Confirmation Bias
Teams prefer data that confirms a deal will close. Reps feed the CRM predominantly with positive interaction updates, creating a skewed data loop. The model learns from this loop and generates forecasts that hallucinate high probability of success on deals that have structurally stalled.
Recency Bias
Managers overreact to short-term patterns, a sudden string of wins or losses, and manually override baseline forecasts. These overrides destroy the predictive validity of the underlying model while introducing a false sense of managerial control.
Anchoring Bias
Initial deal values and close dates entered during early discovery act as psychological anchors. Reps and managers fail to adjust these anchors downward as deals evolve, forcing the forecasting algorithm to operate on persistently inflated inputs.
Sandbagging
Experienced reps intentionally hold high-probability deals out of the formal pipeline to protect their target performance. This creates an artificial deficit in the model’s training data, causing systematic underestimation of upcoming revenue.
Note: The critical insight here, one that most RevOps content misses, is that these biases compound. A model trained on sandbagged, anchor-inflated, optimistically logged deal data is not just wrong; it is wrong in a direction that feels good to the people reviewing it. The hallucinated forecast confirms what the sales team wanted to believe.
The Operational Landscape: Choosing the Right Forecasting Tier
Understanding the three-tier architecture of enterprise revenue intelligence platforms is essential before any technology investment decision. The most expensive mistake in SaaS operations is deploying six-figure forecasting software on top of poor CRM hygiene.
Tier 1: Enterprise Suite (Clari, Gong Forecast)
├── Requires clean data layers & unified licenses
└── Best for complex, high-ACV multi-threading (>$15K ACV)
Tier 2: CRM Native (Salesforce Einstein, HubSpot Pro)
├── Built inside the CRM database
└── Best for unified data without sync lag (<50 reps)
Tier 3: SMB & Spreadsheet-Native (Monday CRM, Scoop Analytics)
├── Low-cost, highly flexible, rules-based
└── Best for small teams (<10–50 reps) with simple pipelines
- Tier 1 (Gong, Clari) captures over three hundred unique buying signals, including multi-threading indicators and call sentiment shifts. However, these platforms require unified enterprise licensing, often pushing operational software costs beyond $500 per user per month. Their native failure mode is critical: they draw from CRM via API, meaning they inherit every data quality failure from the source system.
- Tier 2 (Salesforce Einstein, HubSpot) operates natively inside the CRM database, eliminating the sync delays, field-mapping gaps, and bulk-export limitations that affect external platforms. At $90 to $150 per user per month, they are significantly more cost-effective for organizations with up to fifty representatives. The failure mode here is model staleness, native engines trained on historical win/loss benchmarks go stale without scheduled retraining as market conditions evolve.
- Tier 3 (Monday CRM, Scoop Analytics) serves teams where complex ML is statistically unreliable due to small sample sizes. For average deal values under $15,000 and teams under ten reps, rules-based stage-weighted metrics outperform six-figure ML platforms because the training volume is insufficient to produce stable predictions.
| Platform | Pricing | Ideal Customer Profile | Core Failure Mode |
|---|---|---|---|
| Gong Forecast | $30K–$100K+/yr | High-growth teams, deep deal inspection | Sync delays; inherits CRM data quality failures |
| Clari | Custom enterprise contracts | Large enterprises, complex segment roll-ups | Biased manager override logic; no native CRM cleanup |
| Salesforce Einstein | $150+/user/mo | Enterprise orgs with complex CRM configs | Native models go stale without scheduled retraining |
| HubSpot Forecasting | $90–$100/user/mo | Mid-market, <50 reps, standard cycles | Limited granularity; weak multi-product overlay support |
| Monday CRM | $12–$15/seat/mo | SMBs, <10 reps, simple pipelines | No true ML; relies on static rule percentages |
| Scoop Analytics | $299/mo flat | Spreadsheet-native teams, basic triangulation | Fully dependent on manual data integrity |
MAPE vs. MASE: The Mathematical Validation Shift Every RevOps Team Needs to Make

Most enterprise teams still use Mean Absolute Percentage Error (MAPE) as their primary forecast accuracy metric. It is intuitive. It is broadly understood by non-technical executives. And it is structurally broken for modern, complex sales cycles.
Note: If the mathematical formulas below look intimidating, please do not worry, you do not need to calculate this by hand. We have built fully functional interactive calculators directly into the sections below to handle the math for you.
MAPE is calculated as:
$$\text{MAPE} = \frac{100%}{n} \sum_{t=1}^{n} \left| \frac{y_t – \hat{y}_t}{y_t} \right|$$
where is actual revenue, is forecasted revenue, and is the number of periods.
The problem is in the denominator. If any segment has a period with zero actual sales, common in seasonal, intermittent, or newly launched product lines, MAPE produces an undefined or infinite value. Worse, MAPE is mathematically asymmetric: it penalizes over-forecasting more heavily than under-forecasting, systematically biasing model optimization toward pessimistic projections.
MASE was proposed by Hyndman and Koehler in 2005 specifically to address MAPE's structural failures. It evaluates model performance relative to a naive baseline, the simplest possible forecast that simply projects the previous period's actual revenue:
$$\text{MASE} = \frac{\frac{1}{J} \sum_{j=1}^{J} |e_j|}{\frac{1}{T-1} \sum_{t=2}^{T} |y_t - y_{t-1}|}$$
where represents forecast error in the out-of-sample period, is the number of test forecasts, and the denominator is the Mean Absolute Error of the naive in-sample baseline across historical periods.
The interpretation is operationally clear:
- MASE < 1.0: The model outperforms the naive baseline, it adds real mathematical value.
- MASE = 1.0: The model performs on par with simply projecting last period's actuals.
- MASE > 1.0: The model is actively worse than the naive baseline. It is introducing noise, not insight, and is not production-ready.
To calculate MASE in a spreadsheet, list your actuals and forecasts in columns.
- Find your model's Mean Absolute Error (MAE) by taking the average of the absolute differences between actuals and forecasts:
=AVERAGE(ABS(Actuals_Range - Forecasts_Range)). - Find the naive baseline's MAE by taking the average of the absolute differences between the current actual and the prior actual:
=AVERAGE(ABS(Actuals_Today - Actuals_Yesterday)). - Divide the first value by the second value:
=Model_MAE / Naive_MAE.
ABS inside AVERAGE as an array formula.
Enter your model's average forecast error and the historical naive baseline MAE to assess whether your forecasting model is production-ready.
Expert Tip: Require any predictive model to demonstrate a stable MASE < 1.0 in at least two consecutive quarters of parallel testing before using its outputs for financial planning. A model that looks impressive in demos but cannot beat a naive baseline in production testing is not a forecast enhancement, it is a hallucination engine with a polished UI.
The Revenue Data Reliability Index (RDRI): Governing the Foundation
The most important insight in modern RevOps governance is also the most counterintuitive: data quality is not an IT problem. Assigning CRM hygiene to a systems administrator is the organizational equivalent of asking the mailroom to manage your CFO's financial model. IT can build validation rules. They cannot change the commercial behaviors that determine whether those rules are followed.

Effective data governance belongs to Revenue Operations. RevOps possesses the cross-functional authority, commercial visibility, and direct connection to business outcomes that makes behavioral governance possible.
To operationalize this, leading RevOps teams are deploying the Revenue Data Reliability Index (RDRI), a composite metric that continuously monitors CRM data health across five distinct dimensions:
$$\text{RDRI} = w_1 C + w_2 A + w_3 F + w_4 O + w_5 E$$
where weights and the five signals are:
- C (Completeness): Percentage of revenue-critical fields fully populated across active opportunities.
- A (Accuracy): Verified precision of data, email bounce rates, frequency of pushed close dates without logged progress.
- F (Freshness): Time elapsed since the last commercial interaction or activity update.
- O (Ownership): Clear assignment of accounts to active, non-ramping GTM representatives, eliminating orphan records.
- E (Execution): Adherence to standardized pipeline progression criteria, flagging deals that jump stages without corresponding customer-facing activities.
Rate each signal from 0 to 100, then set its weight. Weights must total 1.0.
The five governance pillars that operationalize the RDRI are not one-time projects. They must be embedded as continuous organizational workflows:
- Define Revenue-Critical Data: Govern a small, high-leverage set of fields that directly feed predictive models. For opportunities: stage, amount, close date, next step, primary stakeholder, and forecast category.
- Standardize Definitions and Processes: Establish objective stage entry and exit criteria. A deal should not advance to "Proposal Sent" without a logged discovery session, a confirmed budget range, and a verified shared next step.
- Automate Data Capture: Sync emails, calendar events, and meeting transcripts directly to CRM records without rep intervention. Manual entry is the primary driver of pipeline data degradation.
- Continuous RDRI Measurement: Move from monthly IT audits to a continuous RevOps-owned dashboard measuring all five signals weekly.
- Align Behaviors Through Incentives: Tie a portion of variable sales commission directly to clean data metrics. High-maturity organizations require active next steps on opportunities before commission eligibility. The behavioral change that follows is faster and more durable than any technical enforcement.
The Triangulated Forecasting Framework: Structural Protection Against Single-Source Hallucination
The most powerful architectural change any RevOps team can make costs zero dollars. It is the shift from single-source forecasting to triangulation.
Triangulation evaluates the revenue trajectory from three distinct, structurally independent perspectives and uses divergence between them as an early warning signal:
When the bottom-up field assessment commits $15 million for a quarter, but real-time pipeline analysis suggests a ceiling of $12 million based on deal velocity, and the ML model projects $11.5 million due to seasonal headwinds, leadership has immediately identified a seven-figure overconfidence bias in the sales team's self-assessment, before the quarter closes.
This convergence or divergence pattern transforms the forecasting conversation. Instead of a weekly meeting where managers negotiate subjective opinions, it becomes an evidence-based analysis of demand signals. When all three perspectives align, confidence is high. When they diverge, that divergence is the diagnosis.
Alongside triangulation, organizations must enforce strict human-in-the-loop (HITL) governance. The emerging research is unambiguous and uncomfortable: the assumption that human review automatically corrects AI errors is empirically unsupported.
A University of Washington study with over 520 participants found that human reviewers frequently adopted biased AI recommendations rather than correcting them, exhibiting what researchers term "automation bias." The mechanism is intuitive: managers infer that AI has broader data access and must know something they do not.
The operational implication is that HITL cannot be treated as an ad hoc review step. It must be operationalized as a measured system with defined KPIs (hallucination rate, annotation throughput, cost per decision), clear SLAs, and randomized holdouts to measure true detection effectiveness.
Clear decision-authority thresholds are essential: AI systems can automate recommendations below defined risk levels, but any projection affecting major resource allocation, quota adjustments, or territory boundaries requires multi-layer human sign-off.
The Forecast Hallucination Propagation Chain: Why the Damage Appears Quarters Later
One of the most critically underreported dynamics in RevOps forecasting is that hallucinations rarely cause immediate, visible failures. They compound silently across organizational systems before becoming visible at the board level.
The ultimate financial failure appears far downstream from the original data gap. By the time the miss becomes visible, organizations have over-hired, over-spent on demand generation, and over-allocated territory resources based on a revenue projection that was never real. Worse, because each step in the chain seems defensible in isolation, accountability is diffuse. No single decision looks wrong. The system failure is invisible until it is catastrophic.
A Contrarian Insight: Better AI Reasoning May Increase (Not Decrease) Hallucination Risk
This finding is among the most important in current AI reliability research, and it is almost entirely absent from vendor documentation.

Recent OpenAI evaluations found that newer, more sophisticated reasoning models hallucinate more frequently than several earlier systems. The mechanism is not a bug, it is a structural consequence of how reasoning works. More capable reasoning models expand the system's ability to construct coherent, internally consistent narratives.
When applied to a forecasting context full of missing CRM fields, incomplete attribution data, and sparse stakeholder signals, reasoning fills gaps. And gap-filling, at sufficient sophistication, becomes indistinguishable from fabrication.
The operational implication for RevOps teams is significant: the more persuasive and analytically detailed your AI forecast explanation sounds, the more, not less, carefully it requires human scrutiny.
Teams that trust sophisticated AI explanations more precisely because they sound sophisticated are falling into a confidence trap. The persuasiveness of the explanation is not a proxy for the accuracy of the underlying data.
Common Mistakes That Create Forecast Hallucinations

Absent Stage-Gate Criteria
Allowing deals to advance through pipeline stages without objective, logged evidence creates the data vacuum that AI models fill with fabrications.
No Scheduled Model Retraining
Native ML models trained on historical data go stale as market conditions shift. Without scheduled retraining, models generate obsolete projections with current-period confidence.
Deploying Advanced Tooling on Dirty Data
Enterprise revenue intelligence platforms are amplifiers, not cleaners. Deploying Gong Forecast or Clari on top of a CRM with thirty percent data decay accelerates the production of hallucinated outputs.
Treating AI Outputs as Directives
AI projections used as direct operational instructions, rather than as one signal within a triangulated framework, remove the human judgment layer that catches fabricated assumptions.
Measuring Accuracy Without Measuring Calibration
A model can achieve acceptable average accuracy while being catastrophically miscalibrated in specific segments, consistently hallucinating high confidence on deals that are structurally stalled. Measuring only the average MAPE misses this entirely.
6 Operational Recommendations for a Hallucination-Resistant RevOps Engine

Audit the CRM Data Layer Before Any AI Tooling Procurement
Calculate the current RDRI score. If any signal falls below seventy, stop the technology procurement process and redirect budget toward data enrichment, automated activity capture, and behavioral governance.
Deploy the RDRI as a Core Business Metric
Move data governance from IT to RevOps. Publish RDRI dashboards weekly. Integrate RDRI scores into pipeline reviews and tie a portion of variable commission to data reliability targets.
Replace MAPE with MASE for All Internal Model Validation
Require any model to demonstrate MASE < 1.0 in at least two consecutive quarters of parallel testing before using its outputs for financial planning. A model that cannot outperform a naive baseline is a hallucination engine.
Implement Triangulated Forecasting Cadences
Run weekly and monthly review cycles comparing bottom-up commitments, pipeline velocity metrics, and ML projections. Use divergence between the three as the primary agenda item for human investigation.
Prioritize Native CRM Revenue Intelligence
Native solutions compute predictions inside the CRM environment, eliminating API sync delays, field-mapping gaps, and the bulk-export limitations that create data drift. This establishes a single source of truth.
Build HITL Governance With Measurable KPIs
Define hallucination rate, annotation throughput, and cost per decision as operational metrics. Set decision-authority thresholds: AI automates below defined risk levels; any projection affecting major resource allocation, pricing, or territory structure requires multi-layer human sign-off from qualified RevOps and financial analysts.
Conclusion: Accuracy Is a Byproduct of Governance
The organizations that will define the next era of revenue predictability are not the ones with the most sophisticated AI models. They are the ones that understood a fundamental truth early: advanced mathematical models cannot compensate for flawed, biased, or decaying data inputs.
Deploying enterprise revenue intelligence on top of poor CRM governance does not improve forecasting, it accelerates the automated production of highly confident, linguistically fluent hallucinations. The $67.4 billion global cost of this misunderstanding is the clearest evidence that RevOps needs to treat data reliability, model validation, and human oversight as first-class operational priorities, not as supporting tasks for the IT team.
The path forward is not simpler or cheaper AI. It is more rigorous governance of the data that feeds it, more mathematically sound validation of the models processing it, more structural triangulation of the outputs it generates, and more operationalized human oversight of the decisions it informs.
Build the foundation first. Measure the RDRI. Validate with MASE. Triangulate before committing. The forecast accuracy your board is demanding will follow, not as a goal, but as a byproduct of the process discipline that precedes it.
Useful Sources:
- NIST AI Risk Management Framework documentation
- MIT research on AI language and confidence calibration
- Hyndman and Koehler's foundational MASE methodology paper
- enterprise deployment data from Gartner's AI in Enterprise reports.


")
")


[…] Read the Full Article → […]
[…] Read the Full Article → […]
[…] Read the Full Article → […]