
The Model Worked Perfectly – Until It Didn’t
Imagine this. Your data science team just spent six months building a fraud detection model. It catches 95% of fraudulent transactions in testing. Everyone is excited. Leadership gives the green light. You push it to production.
Three weeks later, customers are complaining. Fraud is slipping through. The accuracy is dropping. Nobody knows why. Nobody even knew it was happening until users started calling.

Sound familiar? This exact story plays out in organizations every single day, across banking, healthcare, retail, and tech. And here’s the part that stings: the model probably wasn’t the problem. The system around it was.
Research consistently shows that between 68% and 80% of machine learning models built and tested never make it to production at all. Of the ones that do, many degrade silently within weeks. The gap between a brilliant notebook experiment and a reliable production system is enormous, and it costs organizations millions in wasted compute, lost trust, and missed business value.
That gap has a name: MLOps.
This guide walks you through what MLOps is, why it matters, and exactly how it works, from raw data and the first experiment all the way to a self-healing, monitored, production-grade AI system. We’ll use real examples, step-by-step explanations, and practical frameworks so this actually clicks, whether you’re a data scientist, a DevOps engineer, or a team lead trying to understand why scaling AI is so hard.
By the end, you’ll have a clear picture of the full MLOps lifecycle, the most common failure points, and the mindset to build it right.
What You’ll Learn in This Guide
What Is MLOps? A Definition That Actually Makes Sense
MLOps, short for Machine Learning Operations, is the discipline of taking machine learning models from experimental development into reliable, scalable, production environments, and then keeping them working correctly over time.

Think of it this way. A great chef can make an incredible meal for two people in a home kitchen. But serving that same meal to five hundred customers every night? That requires a professional kitchen with workflows, quality checks, staff roles, and systems. The chef’s skill doesn’t change. The infrastructure around them makes all the difference.
MLOps is that professional kitchen for machine learning.
More precisely, MLOps unifies three worlds that rarely talk to each other: machine learning (model building), software engineering and DevOps (deployment and automation), and data engineering (pipeline quality and governance). The goal is to automate and standardize every step between a data scientist’s notebook and a production system that delivers real business value.
According to Google’s foundational research on ML systems published at NeurIPS, the actual ML code in a production system represents a tiny fraction of the total codebase. The rest, data pipelines, monitoring logic, feature engineering, infrastructure orchestration, configuration management, is what makes or breaks the system. This is why MLOps exists. The model is maybe 5–10% of the challenge. The surrounding system is the other 90%.
Key distinction: Traditional software is deterministic. Given the same input, it always produces the same output. Machine learning systems are probabilistic. They depend on a shifting combination of code, data, and model weights, and all three can drift, break, or become stale independently of each other. That complexity demands its own discipline.
Why MLOps Exists: The Problems It Was Built to Solve
To really understand MLOps, you have to feel the pain it was designed to fix. Let’s go back to that fraud detection system.
The data science team built their model in Python on their laptops, using clean historical transaction data from the past two years. The model worked beautifully in that controlled environment. Then it hit production, and reality hit back. Hard.

Problem 1: Environment mismatch
The bank’s production servers run Java applications, not Python. The team had to either rewrite the entire model in Java or fight through compatibility layers. Even after they got it running, the inference speed dropped to three seconds per transaction. For a bank processing thousands of transactions per minute, that’s not a delay, it’s a shutdown.
Problem 2: Performance degradation
After one month in production, the model started missing new fraud patterns. The attackers had changed their tactics. The training data didn’t include these new attack styles, so the model had no idea they existed.
Problem 3: Reproducibility failure
When the team tried to update the model with new fraud examples, they couldn’t reproduce the original training setup. Nobody documented exactly which data snapshot was used, what preprocessing steps were applied, or which hyperparameter settings produced the winning configuration.
Problem 4: No monitoring
The team discovered the model was underperforming only after customers complained. There was no dashboard, no alert system, no automated check running in the background.
Every one of these problems has a name in MLOps: environment consistency, model drift, reproducibility, and production monitoring. And every one of them has a solution. That’s what we’re going to cover.
The MLOps Maturity Model: Where Does Your Team Actually Stand?
One of the most useful frameworks in MLOps is the maturity model. It defines five levels of operational sophistication, from fully manual chaos to autonomous, self-improving systems.
The important thing to understand is that this isn’t a binary. You don’t either “have MLOps” or you don’t. You exist somewhere on this spectrum, and you move through it incrementally.
| Level | Name | What It Looks Like | Biggest Risk |
|---|---|---|---|
| 0 | No MLOps | Notebooks, manual handoffs, email-based model sharing | Zero reproducibility; non-auditable systems |
| 1 | DevOps Only | Automated software releases; model training still manual | Data scientists required for every model update |
| 2 | Automated Training | Managed training environments, experiment tracking, feature stores | Deployment still requires manual steps |
| 3 | Automated Deployment | Full CI/CD for models; A/B testing integrated; lineage tracked | Monitoring may still be reactive |
| 4 | Full Automation | Self-healing pipelines; auto-retraining on drift; zero-downtime ops | Complexity and governance overhead |
MLOps Maturity Model — Organizations move through these levels incrementally
Here’s the honest self-assessment shortcut: if your business users are still the ones who discover model problems first, you’re at Level 0 or 1. If an automated monitoring system catches drift before it affects users and triggers a retraining job without human intervention, you’re approaching Level 4.
Most enterprises sit at Level 1 or 2. Getting to Level 3 is where the real ROI starts to compound.
Key takeaway: MLOps maturity is a journey, not a destination. Every step up the ladder reduces time-to-value and increases system reliability.
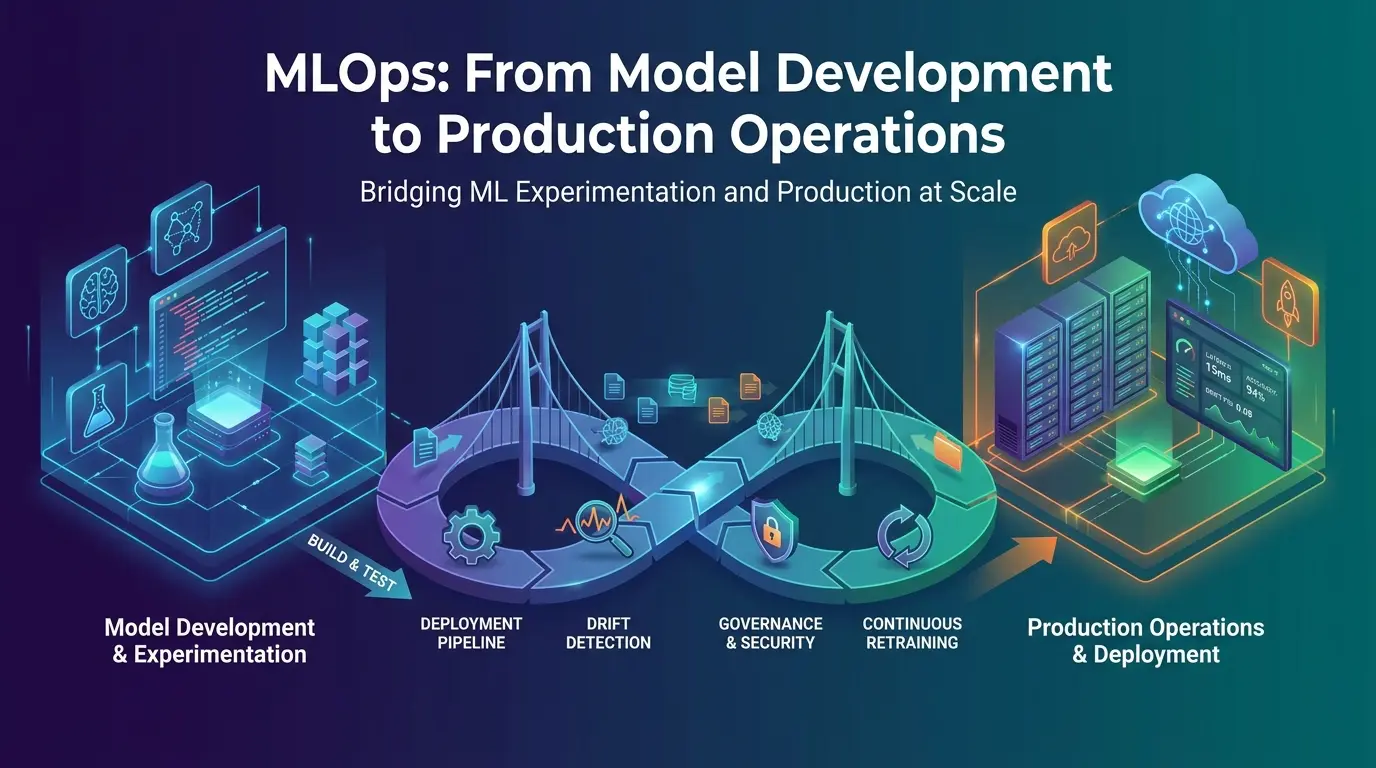
The MLOps Lifecycle: A Phase-by-Phase Breakdown
The MLOps lifecycle is a continuous loop, not a straight line. Each phase feeds back into the others. Here’s how it works in practice.

Phase 1: Problem Framing and Data Engineering
Everything starts with a clear business question. Not “let’s build a machine learning model,” but “we need to reduce fraudulent transactions by 30% this quarter.” The KPI comes first. The model comes second.
Once the problem is defined, data engineering begins. This is consistently the most underestimated phase. Collecting, cleaning, labeling, and versioning data takes more time than training the model itself, often by a factor of three or four.
The critical practice here is treating data like code. Every dataset should be versioned using tools like DVC (Data Version Control) so that any model can be traced back to the exact snapshot of data that shaped it. This is what makes reproducibility possible and makes regulators happy.
Mature MLOps environments also use a Feature Store, a centralized repository of engineered features. This solves a nasty problem called training-serving skew, where the features used during training are computed slightly differently during inference, causing silent prediction errors. A shared Feature Store ensures the same logic runs in both environments.
Phase 2: Experimentation and Model Development
With clean, versioned data, data scientists begin iterating, trying different algorithms, tuning hyperparameters, and comparing model architectures.
Experiment tracking is the essential discipline here. Every experiment run should be logged automatically: which parameters were used, which metrics were achieved, which artifacts were produced. Tools like MLflow are the industry standard for this, giving teams a searchable ledger of everything they’ve tried.
Without this, you end up where that fraud detection team ended up, unable to reproduce the model that worked, with no record of what made it work.
Phase 3: Model Validation and Packaging
Before any model reaches production, it has to pass a gate. This validation phase checks three things: technical performance (does it hit the accuracy benchmarks?), fairness (does it perform equally across demographic groups?), and interpretability (can we explain why it makes the predictions it makes?).
Tools like SHAP (SHapley Additive exPlanations) and LIME are used to surface what the model is actually relying on. In regulated industries like finance and healthcare, this transparency isn’t optional, it’s a legal requirement.
After validation, the model is packaged into a Docker container along with all its dependencies: the specific Python version, library versions, CUDA drivers, and runtime configuration. This is what solves the environment mismatch problem from our fraud detection story. The container runs identically on a developer’s laptop, a staging server, and a production cluster.
Phase 4: Deployment and Release
Deployment is where most of the visible drama in MLOps happens, and where teams make the most expensive mistakes. We’ll cover deployment strategies in depth in the next section. The key principle here is: never go from testing to full production in one jump.
Orchestration tools like Kubeflow Pipelines, Vertex AI Pipelines, or Amazon SageMaker Pipelines automate the sequence of steps: data ingestion, training, validation, and deployment. This removes human error from the process and makes every pipeline run repeatable and auditable.
Phase 5: Monitoring, Drift Detection, and Continuous Improvement
Deployment is not the finish line. It’s the starting gun for a new set of responsibilities.
The model needs to be watched constantly. Infrastructure metrics like latency, error rate, and throughput are the basics. More importantly, the model’s predictions need to be monitored for quality degradation, a phenomenon called model drift.
When drift is detected, the mature MLOps system automatically triggers a retraining pipeline, evaluates the new model, and, if it outperforms the current version, promotes it to production without any downtime. This is the closed loop that separates Level 4 organizations from everyone else.
Key takeaway: The MLOps lifecycle never truly ends. Every deployment feeds new data back into the next training cycle, making the system progressively smarter.
Before vs. After MLOps: What Actually Changes
This is probably the most clarifying comparison you can make.

Before MLOps: the reality for most teams
A data scientist trains a model in a Jupyter notebook on their local machine. They email a model file to an engineer. The engineer tries to run it and discovers they have different library versions. After a week of debugging, they get it running on a server. Nobody documented the training process.
The model’s accuracy in production is lower than in testing, but nobody knows why. Three months later, fraud rates climb, and the team only finds out through a customer complaint.
After MLOps: what the same team looks like
Every experiment is tracked automatically in MLflow. The model is packaged in a Docker container with all its dependencies. A CI/CD pipeline runs automated tests, speed tests, accuracy gates, fairness checks, before any model touches production.
Deployment happens via a canary rollout, so only 5% of traffic sees the new model first. Prometheus and Grafana dashboards show real-time accuracy, latency, and transaction volume. If the fraud detection rate drops below 90%, an automated alert fires and kicks off a retraining job.
The model is the same. The system around it is completely different.
Deployment Strategies: Choosing the Right Approach for Your Risk Tolerance
How you deploy a model is just as important as how you train it. Different strategies offer different tradeoffs between speed, safety, and resource cost.
| Strategy | How It Works | Best For | Main Tradeoff |
|---|---|---|---|
| Shadow Evaluation | New model runs in parallel; predictions logged but not served | Zero-risk validation of real-world behavior | Requires duplicate infrastructure |
| Canary Release | New model serves 5% of traffic; expands gradually if healthy | Controlled exposure with early bug detection | Needs careful monitoring of small sample |
| Blue-Green | Two identical environments; traffic switches instantly | Zero-downtime deployments with fast rollback | Doubles infrastructure cost during transition |
| A/B Testing | Users randomly split between model versions; outcomes compared | Measuring real business impact of model changes | Requires large sample sizes; time-intensive |
| Multi-Armed Bandit | Traffic allocated dynamically based on real-time performance | Maximizing ROI while still exploring alternatives | Complex to implement, monitor, and debug |
MLOps Deployment Strategy Comparison — choose based on risk tolerance and resource availability
For most teams, canary deployments are the right starting point. They limit the blast radius if something goes wrong while still exposing the model to real traffic. Shadow evaluation is ideal when launching a completely new model architecture for the first time, you get real-world data without any user-facing risk.
Key takeaway: There is no universally “best” deployment strategy. The right choice depends on your latency requirements, risk tolerance, team maturity, and infrastructure budget.
Drift Detection: The Silent Killer of Production Models
Even a perfect model degrades over time. The world changes. User behavior shifts. Fraud patterns evolve. Seasonal patterns emerge. All of this changes the data flowing into your model, and eventually, the model’s predictions stop reflecting reality.
This is called drift, and it comes in two distinct flavors.
Data drift (covariate shift) happens when the statistical distribution of your input features changes. Your fraud detection model was trained on transactions from a specific demographic, time period, and spending pattern. When customer behavior shifts, say, a surge in large international transfers that was rare in training data, the model is suddenly operating outside its comfort zone.
Concept drift is more dangerous. This happens when the underlying relationship between inputs and the target variable changes. Fraud patterns are a classic example. Attackers adapt. A model that learned to flag certain transaction patterns in 2023 may be completely blind to the strategies that emerged in 2025. The model isn’t technically “broken”, it’s just learned the wrong lesson.
How to Detect Drift Statistically
The Population Stability Index (PSI) is the industry standard for measuring distributional shift in production ML systems. It compares how the distribution of a feature in production compares to its distribution during training.
📐 Population Stability Index (PSI) Formula
PSI = Σ ( Pactual − Pexpected ) × ln( Pactual / Pexpected )
Pactual = Proportion of observations in a bin from production data
Pexpected = Proportion of observations in the same bin from training data
Summed across all bins (typically 10 equal-frequency bins)
🧮 Interactive PSI Calculator
Enter the actual (production) and expected (training) percentage for up to 5 bins. The calculator will compute your PSI score and interpret the result.
For categorical features, the same PSI approach applies. For continuous numeric features, you typically create 10 equal-frequency bins from the training data, then measure how production observations distribute across those same bins.
Key takeaway: PSI below 0.1 means you’re safe. Above 0.25 means act now. Between those values, set up closer monitoring and investigate which specific features are shifting.
The Contrarian Truth: Most ML Failures Are System Failures, Not Model Failures
Here’s the insight that most MLOps articles completely miss, and it’s arguably the most important one in this entire guide.

When a production ML system fails, we instinctively blame the model. The accuracy was too low. The algorithm wasn’t the right choice. We need more data for training. So the team spends weeks improving the model, retraining from scratch, trying new architectures.
But Google’s own research, from the foundational paper on hidden technical debt in machine learning systems, showed something uncomfortable: the actual ML code in production systems represents a tiny sliver of the total system. The rest is data pipelines, configuration files, serving infrastructure, monitoring logic, and orchestration code. All of that surrounding infrastructure is what fails most often.
A 2023 empirical study across 318 real-world ML projects found that ML projects accumulate roughly double the technical debt compared to equivalent non-ML projects, and that debt appears earlier and lasts longer. The reasons are unique to machine learning: data volatility, probabilistic outputs, hidden feature entanglements, and the training-serving skew problem.
What does this mean in practice?
It means that investing in better data governance, cleaner pipelines, and stronger monitoring frequently delivers more ROI than investing in a more sophisticated model architecture. The team with a simpler model and excellent MLOps infrastructure will outperform the team with a brilliant model and fragile pipelines every single time.
This is not just an engineering insight. It’s a resource allocation insight. If your organization is spending 80% of its AI budget on model research and 20% on infrastructure, you may have the ratio exactly backwards.
Hidden Feedback Loops: The Risk Nobody Is Talking About
There’s a failure mode in production ML systems that almost never makes it into tutorials or technical blog posts, and it’s one of the most damaging. It’s called a hidden feedback loop, and it’s exactly what it sounds like.

When your model makes predictions, those predictions change the world. And when the world changes, the data your model trains on next changes too. The model starts learning from an environment it helped create, not from ground truth reality.
The fraud detection example makes this vivid. Imagine your fraud system only sends transactions for human review when the model flags them. Those reviews generate labeled data, confirmed fraud or confirmed legitimate. But what about the fraud the model didn’t flag? It never gets reviewed. It never gets labeled. It disappears from your training data entirely.
Over time, the model retrains on a dataset that only contains the types of fraud it was already good at catching. The novel fraud patterns it missed? They get silently removed from its worldview. Accuracy metrics look fine, or even improve. But real-world detection is getting quietly worse.
This is why Google’s research on adversarial ML through the MITRE ATLAS framework highlights feedback loops as one of the highest-severity failure modes in production AI. The traditional monitoring metrics, precision, recall, F1, will not catch this. You need to specifically monitor your label generation pipeline and regularly audit whether your training data covers the full distribution of real-world behavior, including the behaviors your model currently fails on.
Recommendation systems face the same problem. Netflix, Spotify, and YouTube all train their recommendation models on user engagement data. But that data reflects the recommendations the model previously made. The model learns to amplify what it already recommends, not necessarily what users genuinely want. Discovery collapses. The system becomes increasingly confident in an increasingly narrow worldview.
The fix is deliberate exploration: periodically injecting random recommendations, using randomized holdout sets for labeling, and monitoring for distribution collapse in your training data over time.
Key takeaway: If your model’s training data is generated or filtered by your model’s own predictions, you have a feedback loop. Audit it explicitly. Traditional metrics won’t surface this problem on their own.
Continuous Integration, Delivery, and Training: The Three Pillars of MLOps Automation
DevOps gave us CI/CD, the practice of automatically testing and deploying code every time a change is made. MLOps extends this with a third pillar that has no equivalent in traditional software engineering.

Continuous Integration (CI) in MLOps means more than linting Python files. It means automatically validating that data schemas haven’t broken, that statistical distributions of input features haven’t shifted unexpectedly, that model accuracy on holdout data meets the required threshold, and that the model doesn’t exhibit bias across protected demographic groups. All of this runs on every commit to the training codebase.
Continuous Delivery (CD) means that when a model passes all CI checks, it’s automatically deployed to the appropriate environment, staging, then production, without a human having to manually promote it. This is where canary and blue-green strategies plug in. The pipeline handles the rollout, the monitoring of the rollout, and the rollback if something goes wrong.
Continuous Training (CT) is the distinctly MLOps innovation. It’s the ability to automatically retrain a model when certain conditions are met, a scheduled time trigger, a data drift alarm, a performance metric dropping below threshold, or the arrival of a significant new batch of labeled data. CT is what transforms a deployed model from a static artifact that decays over time into a living system that adapts to the real world.
According to Google Cloud’s MLOps best practices documentation, CT is the defining characteristic that separates a basic ML deployment from a mature MLOps system. Without it, every model update still requires a human to initiate the process, which means the model’s freshness is limited by human bandwidth.
Key takeaway: CI/CD/CT work together as a closed loop. CI validates. CD deploys. CT keeps the system current. All three are required for a genuinely production-grade MLOps pipeline.
Common Mistakes That Kill MLOps Implementations (And How to Avoid Them)
These aren’t hypothetical pitfalls. They’re patterns seen repeatedly across organizations at every size and maturity level.

Mistake 1: Skipping environment consistency from day one.
Teams tell themselves they’ll standardize environments “once things are more stable.” They never are.
The fix is simple: require Docker containers for all model development from the first experiment, not just at deployment time. If the development environment looks nothing like production, every deployment becomes a debugging exercise.
Mistake 2: Treating deployment as the finish line
The model is live. Champagne. Done. No, done is when you have monitoring in place, drift alerts configured, and a retraining pipeline ready to fire. A model without monitoring is a ticking clock.
Mistake 3: Logging too much, observing too little
Organizations often respond to monitoring failures by adding more metrics, more dashboards, more alerts. This creates alert fatigue. Teams start ignoring notifications. Genuine problems get missed.
The fix isn’t more monitoring, it’s smarter monitoring. Focus on the three to five metrics that most directly predict business impact: fraud detection rate, conversion rate, prediction latency, and drift PSI for the highest-impact features.
Mistake 4: Retraining on a fixed calendar schedule
“We retrain every Monday” sounds disciplined. But it’s arbitrary. If drift accelerates during a product launch or a market event, Monday is too late. If the model is stable, Monday’s retrain wasted compute budget. Use event-driven retraining triggered by drift detection, not calendar reminders.
Mistake 5: Underestimating data debt
Most teams focus on model improvement when things go wrong. But silent schema changes in upstream data, stale features in the feature store, and weak data lineage tracking are responsible for a disproportionate share of production failures. Treat your data pipelines with the same rigor as your model code. Version them. Test them. Monitor them.
Mistake 6: Building without governance from the start
Under the EU AI Act, high-risk AI systems now require documented training data lineage, model performance audits, and human oversight mechanisms. These are extremely difficult to retrofit after the fact. Build model cards and audit trails into your workflow from the beginning, not when a regulator asks for them.
Security in MLOps: Protecting Your Models from Adversarial Threats
Machine learning models are vulnerable to attack vectors that traditional software security wasn’t designed to stop. This growing field is called MLSecOps, security engineering applied to the ML lifecycle.

The primary threat categories are:
- Data poisoning: Attackers inject malicious samples into the training dataset, causing the model to learn incorrect patterns or develop hidden backdoors. A fraud detection model could be poisoned to consistently miss transactions from specific accounts.
- Adversarial evasion: At inference time, subtle, often imperceptible modifications to input data can cause the model to make wildly incorrect predictions. A pixel-level change to an image that’s invisible to the human eye can flip a classification from “benign” to “approved.”
- Model extraction: By systematically querying a public API, an attacker can reconstruct a close approximation of the model’s internal parameters, effectively stealing it without access to the training data.
- Supply chain attacks: Vulnerabilities in open-source libraries, Docker base images, or CI/CD configurations can be exploited to inject malicious code before a model even reaches production.
The MITRE ATLAS framework provides a systematic taxonomy of adversarial threats to AI systems, directly analogous to the MITRE ATT&CK framework for traditional cybersecurity. Organizations should use ATLAS to map their specific threat landscape and implement appropriate defenses at each stage of the pipeline.
Defense fundamentals include: data provenance verification (digital signatures on datasets), adversarial training (intentionally exposing models to manipulated samples during training), API rate limiting and anomaly detection, Role-Based Access Control with the principle of least privilege, and container image scanning in CI/CD pipelines.
Governance, Ethics, and the EU AI Act: Compliance Is Not Optional
The regulatory environment around AI has fundamentally changed. The EU AI Act classifies AI systems into risk tiers and mandates strict requirements for “high risk” applications, including credit scoring, recruitment tools, and biometric identification.

For MLOps practitioners, the compliance implications are concrete:
Organizations must be able to reproduce any production decision made by a high-risk AI system, including the exact model version, the training dataset snapshot, and the code commit that generated that decision. This requires immutable model registries, dataset versioning, and comprehensive experiment tracking. An MLflow registry or equivalent isn’t a convenience, it’s a compliance requirement.
Model Cards are the standardized documentation format for this transparency. A well-written model card describes the model’s intended purpose, the data it was trained on, its performance metrics across demographic subgroups, known limitations, and recommended use cases. Think of it as the nutritional label for your AI system.
Datasheets for Datasets provide complementary documentation, recording the origin, collection process, and composition of training data so that historical biases can be identified and addressed before they propagate into production.
The practical advice for teams: build your audit trail now. Every model version promoted to production should be logged with its training data hash, code commit SHA, performance metrics, and the human who approved the promotion. If a regulator audits a decision made six months ago, you need to be able to answer in hours, not weeks.
LLMOps and Edge MLOps: The New Frontiers
The rapid rise of large language models and edge AI has created two specialized branches of MLOps, each with distinct challenges.

LLMOps
LLMOps addresses the unique operational demands of foundation models and generative AI. Prompt management becomes as critical as code versioning, a poorly designed prompt can cause a correctly fine-tuned model to produce harmful, biased, or factually incorrect outputs.
Organizations now maintain prompt libraries with version control, evaluation pipelines that test for hallucinations and toxicity, and guardrail systems that intercept dangerous outputs before they reach users.
Fine-tuning and Retrieval-Augmented Generation (RAG) introduce their own operational complexity. RAG systems depend on vector databases and document retrieval pipelines that must be monitored and refreshed independently of the model itself. If the knowledge base becomes stale, the model’s answers become wrong, even if the model weights are perfectly up to date.
Edge MLOps
Edge MLOps addresses the challenge of deploying models on resource-constrained devices, mobile phones, IoT sensors, industrial controllers, and autonomous vehicles. Models trained in the cloud must be compressed using quantization and pruning techniques before they can run efficiently on edge hardware.
A ResNet model that takes 100MB on a GPU cluster might need to be compressed to under 5MB for deployment on a microcontroller.
Maintaining these edge models requires over-the-air (OTA) update systems with rollback capabilities, critical when connectivity is intermittent and a failed update could take a production system offline indefinitely.
Telemetry from edge devices flows back to central servers to inform the next retraining cycle, creating a global feedback loop between deployed devices and the training pipeline.
The MLOps Platform Landscape: Choosing Your Stack
The market for MLOps tooling is vast. Choosing the right combination of tools is less about finding the “best” platform and more about matching your team’s expertise, cloud preference, and regulatory requirements.
| Platform | Best For | Standout Strength | Watch Out For |
|---|---|---|---|
| AWS SageMaker | AWS-native enterprises | End-to-end managed lifecycle; deep AWS ecosystem integration | Vendor lock-in; cost at scale |
| Google Vertex AI | GCP teams with LLM needs | Unified data + AutoML; strong foundation model integration | Steep learning curve; cost visibility |
| Azure ML | Regulated, Microsoft-centric enterprises | Strong governance, compliance, and DevOps integration | Dense UI; complex local development |
| MLflow | Framework-agnostic teams | Industry-standard experiment tracking; vendor-neutral | Not production-grade for serving at scale alone |
| Kubeflow | Kubernetes-experienced teams | Portable pipelines; maximum infrastructure control | High operational burden; Kubernetes expertise required |
| Databricks | Data-centric, analytics-heavy teams | Unifies data engineering, analytics, and ML on one platform | Premium cost; overkill for simpler ML use cases |
MLOps Platform Comparison — no single platform excels at everything; most mature stacks combine 2–3 tools
The practical recommendation for most teams: start with a managed cloud platform (SageMaker, Vertex AI, or Azure ML) for the operational simplicity, and layer in open-source tools like MLflow for experiment tracking where the managed platform’s capabilities fall short.
Avoid tool sprawl, every additional platform adds integration complexity and training burden.
The Future of MLOps: Where the Field Is Headed
The industry is moving in clear directions, and understanding them now lets you build infrastructure that won’t need to be ripped out in two years.

Governance-native MLOps is the biggest shift. Rather than adding compliance documentation as an afterthought, modern platforms are embedding lineage tracking, audit trails, and policy enforcement directly into the pipeline execution layer. If a model violates a fairness constraint, the pipeline stops automatically.
AI-driven observability is replacing dashboard-based monitoring. Instead of humans watching metrics and deciding when something looks wrong, ML-powered anomaly detection systems watch the watchers, surfacing unexpected correlations, emerging drift patterns, and potential failure modes before they escalate.
Reliability engineering for AI is maturing into its own discipline. The principles of Site Reliability Engineering (SRE), SLOs, error budgets, blameless postmortems, are being applied directly to ML systems. Rather than measuring models by benchmark accuracy, high-maturity organizations are defining reliability SLOs: “this model must respond within 50ms at P99 latency, 99.9% of the time.”
Monitoring inflation is an emerging risk that deserves attention. As organizations deploy more models and add more monitoring layers, the volume of operational alerts grows faster than human review capacity. The solution isn’t more monitoring, it’s smarter, hierarchical observability with clear escalation paths and automated first-level triage.
The organizations that will lead in AI over the next five years aren’t necessarily the ones with the biggest models or the largest datasets. They’re the ones with the most reliable, governed, and cost-efficient operational infrastructure around those models. MLOps is the discipline that makes that possible.
Conclusion: The Infrastructure That Makes AI Real
MLOps is not a tool you buy or a checklist you complete. It’s a discipline, a set of principles, practices, and cultural habits that transform machine learning from a research activity into a reliable business capability.
The model is just the beginning. The data pipelines, containerized environments, CI/CD/CT automation, drift monitoring, experiment tracking, and governance frameworks, that’s the 90% of the system that determines whether the model ever delivers value.
Start where you are. If you’re at Level 0, notebooks and manual handoffs, the first move is environment consistency and experiment tracking. If you’re at Level 2, focus on automating your deployment pipeline and wiring up drift monitoring. Every step forward compounds.
The teams that treat MLOps as a competitive advantage, not a compliance burden, are the ones that will get models to production faster, keep them working longer, and scale AI across their organization with confidence.
Build the kitchen. Then let the chefs cook.
Ready to take your MLOps practice to the next level? Use the checklists, frameworks, and playbooks in this guide to assess your current maturity, identify gaps, and build a roadmap for scalable, governed, and profitable AI operations in 2026 and beyond.
For more actionable frameworks, compliance checklists, and advanced playbooks, bookmark this guide and revisit as your MLOps journey evolves.


[…] Read the Full Article → […]