
Here’s a number worth sitting with: in the first half of 2025, approximately 76% of B2B sales representatives missed their quota. Not 10%. Not 30%. Three out of every four sellers.
And here’s what makes that staggering, most of those teams had dashboards full of KPIs. They tracked calls, emails, pipeline stages, and deal counts. They ran weekly reviews. They coached on activity. They still missed.
The problem wasn’t effort. It was measurement. They were tracking the wrong things, or tracking the right things the wrong way. The result was a systemic failure dressed up as individual underperformance.
This guide is built to fix that. We’ve drawn on data from 938 companies, benchmarks from enterprise SaaS and B2C e-commerce, and emerging research in organizational psychology and AI governance to give you a complete, honest, and actionable picture of sales KPIs in 2026.
")
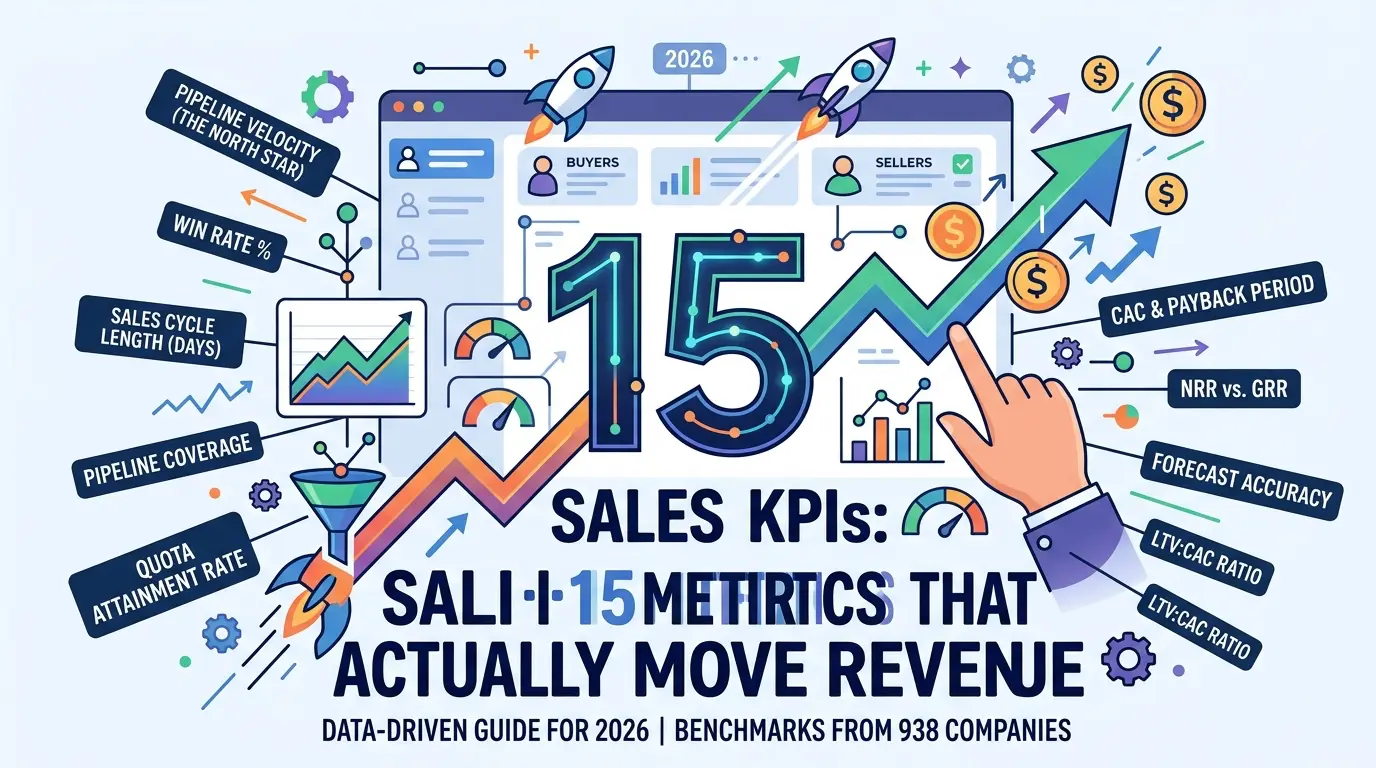
You’re not going to get a list of 38 metrics. You’re going to get a framework: which 15 KPIs actually move revenue, how to calculate them, how to choose the right ones for your team size, and critically how to avoid the hidden traps that make even well-designed KPI systems self-defeating over time.
Let’s start with what actually matters.
- Start with 5 core KPIs, velocity, win rate, cycle length, pipeline coverage, and quota attainment
- Pipeline Velocity is the only metric that captures all four revenue levers simultaneously
- 76% of B2B sellers missed quota in H1 2025, usually a measurement problem, not a motivation problem
- Goodhart’s Law quietly destroys KPI systems at scale, learn to design metrics that resist gaming
- Blended conversion averages hide an 8.6x performance gap between inbound and outbound channels
- A 90-day implementation roadmap turns strategy into structured, measurable habit
What Makes a Sales KPIs Actually Useful?
Not every number is a KPI. That distinction sounds obvious, but it’s exactly where most measurement systems break down.
A metric is any data point you can measure. A KPI (Key Performance Indicator) is a metric that is directly tied to a business outcome, gives you enough time to act on it, and is genuinely actionable by the person reviewing it.
")
Here’s a practical test. The number of emails your team sends each week is a metric. The percentage of those emails that convert into discovery calls is a KPI. One tells you how busy your team is. The other tells you whether that activity is actually generating pipeline.
The leading vs. lagging divide
Think of leading indicators as your headlights. They show you what’s ahead: pipeline coverage, early-stage conversion rates, meeting generation volume. Lagging indicators are your gauges after the fact: total revenue closed, quota attainment, annual churn rate.
Both matter, but for different reasons. If your KPI system is built entirely from lagging indicators, you’re managing from the rearview mirror. By the time revenue drops in your dashboard, you’ve already lost a full quarter of selling time.
The best sales organizations build what researchers call an indicator chain: daily outreach volume feeds meeting conversion rates, which build pipeline coverage, which predicts quota attainment, which drives total revenue. When you can see every link in that chain, you know exactly where to intervene, and when.
Three criteria for a high-quality KPI
Before adding any metric to your dashboard, run it through these three questions:
- Is it actionable? Can a manager or rep do something specific when this number changes?
- Is it revenue-aligned? Does it connect to a real business outcome?
- Is it honest? Will people optimize for the metric, or for the underlying result the metric is supposed to represent?
That third criterion is the one most organizations ignore entirely. It connects directly to the biggest hidden risk in modern sales analytics, a concept we’ll examine in depth later in this guide.
Takeaway: A good KPI is actionable, revenue-aligned, and resistant to gaming. Every metric on your dashboard should pass all three tests before it earns a spot.
The 5 Core Sales KPIs Every Team Must Track
If you’re building a metrics culture from scratch, the temptation is to measure everything. Resist it. Analysis paralysis is real, and a dashboard with 30 KPIs produces the same practical result as one with zero: inaction.
")
Start with five. Build from there.
1. Pipeline Velocity: The North Star Metric
Here’s the most important insight in this entire guide: most sales teams treat win rate as their primary health indicator. But win rate only tells you one thing. Pipeline velocity tells you four simultaneously.
Pipeline velocity measures how quickly revenue is actually moving through your funnel. It captures the number of qualified opportunities, your average deal size, your win rate, and your sales cycle length in a single calculation. It’s not just a metric. It’s a diagnostic engine. When velocity drops, you immediately know which of four levers to investigate.
Only about 32% of sales teams actively track it. That gap is a competitive advantage waiting to be seized.
The 4-lever improvement framework:
When pipeline velocity falls, you have four specific interventions. The fastest-growing teams pull all four simultaneously. Most teams pull only one, usually the easiest.
- Opportunities lever: Generate more qualified leads, improve prospecting. Typical impact: +20–50% pipeline volume
- Deal Size lever: Upsell, move upmarket, bundle offerings. Typical impact: +15–30% average value
- Win Rate lever: Improve qualification, sharpen competitive positioning. Typical impact: +25% revenue from the same pipeline
- Cycle Length lever: Remove friction, accelerate decisions. Typical impact: 40–60% compression, especially with inbound
Benchmark: Aim for 15–20% quarter-over-quarter velocity improvement. If you have no baseline yet, calculate your current number and measure consistently over 90 days before setting targets.
2. Win Rate
Win rate measures what percentage of the deals you actively competed for closed in your favor. It’s a direct indicator of sales execution quality, your discovery skills, your competitive positioning, and how well you qualify before deals reach late stages.
The global B2B mid-market average sits around 20–21%. But that number needs context. A 20% win rate on enterprise deals with 90-day cycles looks completely different from a 20% win rate on SMB deals with 15-day cycles.
According to HubSpot’s State of Sales research, the most common driver of low win rates isn’t closing technique, it’s poor qualification early in the funnel. Reps spend time on deals they were never going to win.
One additional signal worth tracking alongside win rate is offer rate, the percentage of qualified prospects your reps actually make an offer to. If that number drops below 80%, it usually isn’t a lead quality problem. It’s a conviction gap. The rep doesn’t feel confident enough in the offer to present it consistently. That distinction changes everything about how you coach.
Before: A sales manager sees 18% win rate. She knows it should be higher but doesn’t know why it’s low.
After: She tracks win rate by deal stage, lead source, and rep, and discovers 60% of losses happen after pricing is introduced against a specific competitor. That insight produces a competitive battle card. Win rate climbs to 23% within two quarters.
Benchmarks by segment:
- SMB under $25K ACV: 25–35% win rate target
- Mid-market $25K–$150K ACV: 20–25% win rate target
- Enterprise $150K+ ACV: 15–20% win rate target
3. Sales Cycle Length
The average B2B sales cycle has stretched to 6.5 months, a 38% expansion compared to prior periods. Why? Buying committees are larger. The average enterprise deal now involves 6–10 cross-functional stakeholders, and major transactions can involve upward of 17 decision-makers. More approvers means more friction. More friction means longer cycles.
The most overlooked data point here: if a deal slips past its projected close date by more than eight weeks, its win probability drops by as much as 67%. Deals don’t just slow down. They die quietly in your pipeline while consuming rep time and inflating your coverage ratio.
Two things consistently compress cycle length: strong multi-threading (engaging multiple stakeholders simultaneously rather than relying on a single contact) and inbound-sourced leads, which tend to close 40–60% faster than cold outbound.
Benchmarks: SMB 30–60 days. Mid-market 90–180 days. Enterprise 180–365+ days.
4. Pipeline Coverage Ratio
Pipeline coverage answers a deceptively simple question: do you actually have enough in the funnel to hit your number?
Divide total qualified pipeline value by your revenue target for the period. Standard target: 3:1 to 5:1, you need $3 to $5 in qualified pipeline for every $1 of target you’re trying to close.
The trap: high pipeline volume does not equal healthy pipeline. A 5:1 coverage ratio filled with stalled, single-threaded, or poorly qualified deals will still produce a miss. Always pair coverage ratio with your Pipeline Health Ratio, the percentage of your pipeline that is actively progressing toward close. A healthy organization maintains 70–80% of its pipeline in active, non-stalled status.
Practical threshold: If pipeline coverage drops below 3:1, stop other activities and run a lead generation sprint immediately. Don’t wait for the end-of-quarter fire drill.
5. Quota Attainment Rate
Quota attainment measures actual performance against assigned targets. The benchmark for a healthy team is 60–70% of reps achieving at least 80% of quota. If fewer than 50% of your reps are hitting quota consistently, the most likely cause isn’t underperformance. Quotas were set too aggressively relative to market conditions, cycle length, or available pipeline.
In late 2024, the average quota attainment across B2B sales fell to approximately 43%. That is a structural failure, and it reflects a fundamental mismatch between how quotas are typically set (top-down financial planning) and how buyers actually make decisions (cautiously, slowly, with large committees).
Before you run another performance improvement plan, ask whether the quota itself is realistic based on current market conditions.
Takeaway: These five KPIs connect daily activity to quarterly outcomes and give you enough signal to intervene before problems compound. Master them before adding anything else.
Advanced KPIs for Growing Teams (10–50 Reps)
Once your foundation is stable, these metrics separate good sales organizations from great ones.
")
Customer Acquisition Cost (CAC) and Payback Period
CAC measures what you spend to win each new customer. The payback period tells you how long it takes to recover that investment through revenue. For B2B SaaS, the median CAC payback period is 15–18 months. Top-quartile performers achieve payback in under 12 months.
In a capital-constrained environment, payback period is a survival metric. A company with a 30-month payback period requires dramatically more capital to grow than one at 10 months, and that difference compounds every quarter.
Net Revenue Retention (NRR) vs. Gross Revenue Retention (GRR)
This distinction is one of the most important in subscription business analytics, and one that many leaders miss until it’s too late.
NRR includes expansion revenue, upsells and cross-sells from existing customers. A company at 110% NRR can look like it’s growing beautifully. But if expansion revenue is masking 15% annual customer churn, the underlying business is at risk the moment expansion slows.
GRR strips out expansion entirely. It shows only what percentage of your starting revenue base you actually retained. According to SaaS Capital’s annual benchmark report, healthy enterprise SaaS GRR should sit above 90%. Below 85% signals a product or customer success problem that no amount of upselling can sustainably cover.
Strategic guidance: track both. NRR tells your expansion story. GRR tells your retention truth.
Forecast Accuracy and Revenue Growth Rate
Forecast accuracy measures how closely predicted revenue matches actual revenue. Top-performing teams target 90%+ accuracy. In enterprise sales, forecast errors regularly exceed 25–40% in volatile quarters. The deeper issue: most forecast inaccuracy is organizationally induced, not the result of individual error.
Quarter-end pressure produces optimistic stage advancement, deal pull-forward, and artificial close timeline compression. Reps protect their standing by delaying bad-news recognition. Board-level data becomes structurally biased toward optimism.
LTV:CAC Ratio
Customer Lifetime Value divided by Customer Acquisition Cost is the fundamental unit economics test. Minimum viable: 3:1. Top performers target 5:1 or higher. One critical nuance: inbound customers consistently achieve 20–30% higher LTV than outbound customers, with 50–60% lower churn. Your blended LTV:CAC ratio is probably hiding a meaningful performance gap between channels that blended averages make invisible.
Takeaway: Advanced metrics like GRR, payback period, and LTV:CAC reveal the efficiency and long-term health of your commercial model, things top-line revenue growth alone will never surface.
The Warning Nobody Talks About: Goodhart’s Law in Sales
Here’s the contrarian insight that should change how you think about everything above.
In 1975, economist Charles Goodhart formulated a principle that has become one of the most important ideas in management science: when a measure becomes a target, it ceases to be a good measure.
In plain terms: the moment you hold people accountable to a metric, they begin optimizing for that metric, regardless of whether that optimization produces the underlying result you actually care about.
This is happening in sales organizations right now, quietly and at scale.
")
When call volume becomes a KPI target, reps make more calls, including calls that last 10 seconds, calls to contacts who don’t exist, calls logged without ever dialing. Call volume climbs. Pipeline velocity falls. The metric looks healthy. The business doesn’t.
When demo bookings become an SDR target, reps start booking meetings with underqualified prospects just to hit the number. Demo count increases. Demo-to-close rate drops. The QBR presentation looks strong. The revenue target isn’t met.
This dynamic is especially dangerous as organizations scale AI-assisted outreach tools. When AI generates thousands of outreach activities automatically, managers see high activity density and interpret it as pipeline health. What they’re actually looking at is synthetic productivity, high volume, low signal.
According to NIST’s AI Risk Management Framework, automation bias is one of the most significant oversight failure modes in AI-augmented human workflows. Managers over-trust AI-generated activity signals because the data looks organized, complete, and impressive.
The research community calls this CRM contamination: data that is technically present but operationally misleading.
The four warning signs Goodhart’s Law is corrupting your KPI system:
- CRM compliance is high, but forecast accuracy is flat or declining
- Activity metrics look strong, but early-stage conversion rates are falling
- Pipeline coverage is high, but win rates are dropping
- Quarter-end numbers consistently miss despite strong midquarter reporting
The solution is not to stop measuring. It’s to build measurement systems that are harder to game: pair every activity metric with its downstream conversion rate, audit CRM data quality regularly, and use revenue intelligence platforms that capture interaction data automatically rather than relying on manual rep entry.
Before Goodhart’s awareness: A manager tracks call volume. Reps hit their call targets. She reports healthy numbers upward. The team missed quota for the third consecutive quarter. No one understands why.
After Goodhart’s awareness: The same manager tracks call volume alongside connect rate, average talk time, and post-call conversion. She can see that calls went up 40% while the connection rate fell 60%. The activity is hollow. She now coaches on quality, targeting, and timing, not raw volume.
Takeaway: KPI systems become self-defeating when measurement replaces judgment. The antidote is pairing every activity metric with its outcome conversion rate, and treating data quality as a genuine organizational discipline.
SaaS vs. E-commerce: KPI Architecture by Business Model
The most important contextual factor for any KPI framework is your business model. Subscription economics and transactional economics require fundamentally different measurement approaches, and confusing the two is a reliable path to optimizing the wrong things.
")
B2B SaaS: Unit Economics Are Everything
In recurring revenue businesses, long-term viability is determined by the relationship between what it costs to acquire a customer and how much that customer generates over time. The Rule of 40 is the widely used benchmark: your ARR growth rate plus your free cash flow margin should equal 40% or higher. Top-performing growth-stage companies score 60%+.
The Magic Number, annualized net new ARR divided by prior-quarter sales and marketing spend, tells you whether your GTM engine is ready to scale. A score above 1.0 means every dollar invested in sales and marketing returns more than a dollar in ARR. Below 0.5, you’re not ready to scale spend.
According to McKinsey’s research on AI-driven commercial operations, companies deploying revenue intelligence see an average 15% improvement in sales efficiency and 20% reduction in sales cycle length. Those gains show up directly in your Magic Number and Burn Multiple.
B2C E-commerce: Conversion Efficiency Drives Margins
In high-volume transactional environments, the primary KPI shifts to Revenue per Visit (RPV), revenue generated per website session. RPV captures both conversion rate and average order value in a single number.
The most dangerous trap in e-commerce analytics is over-relying on Gross Merchandise Volume (GMV). It looks impressive. It generates large headline numbers. But GMV doesn’t account for returns, promotional discounts, or fulfillment costs. A business with $10M GMV and a 25% return rate is not the same as one with $10M GMV and a 5% return rate.
| Dimension | B2B SaaS | B2C E-commerce |
|---|---|---|
| North Star KPI | Net Revenue Retention (NRR) | Revenue per Visit (RPV) |
| Growth Signal | ARR Growth Rate (26–30% median) | Conversion Rate (2.9% global avg) |
| Retention Signal | GRR — target 90%+ | Repeat Purchase Rate |
| Efficiency Signal | CAC Payback Period (<12 months) | Cart Abandonment Rate |
| Expansion Signal | Expansion Revenue % (30–50% target) | Average Order Value (AOV) |
| Vanity Metric Risk | NRR masking high churn with expansion | GMV hiding return rates and margins |
| Capital Efficiency | Rule of 40 Score, Burn Multiple | Contribution Margin per Visit |
Takeaway: The right KPI depends on your revenue model. SaaS teams anchor on retention and unit economics. E-commerce teams anchor on conversion efficiency and contribution margin.
KPI Selection by Team Size: The Progressive Framework
One of the most expensive mistakes in sales management is applying enterprise-level metric complexity to a small team. A five-rep team with 20 closed deals in a quarter doesn’t have enough data volume to make 15 KPIs statistically meaningful. The noise overwhelms the signal.
Build your foundation first. Add complexity as your team and data mature.
| Team Size | Core KPIs to Track | Primary Focus |
|---|---|---|
| < 10 Reps | Win Rate, Sales Cycle, Pipeline Coverage, Quota Attainment, Revenue Growth | Prove product-market fit; close efficiently |
| 10–30 Reps | Add: Pipeline Velocity, CAC, Demo-to-Close Rate, Lead Response Time | Optimize conversion; build predictability |
| 30–50 Reps | Add: LTV, Forecast Accuracy, Coaching Coverage, NRR/GRR, Rep Ramp Time | Forecast reliably; manage rep-level performance |
| 50+ Reps | Add: Sales Efficiency Ratio, SDR Pipeline Contribution, Territory-Level Analysis | Scale efficiently; optimize by segment and region |
Research from an analysis of 150 SMB sales organizations found that teams tracking 5–7 core KPIs achieved 91% quota attainment, compared to 73% for teams tracking 0–3 metrics. More data isn’t better data. The right data, tracked consistently, is what actually moves performance.
One additional framework worth adopting for performance management is the three-tier standard used by high-performing sales departments: Minimal Acceptable Standard (the floor, equivalent to a C-minus), On Par (meeting expectations, steady B performance), and Set the Standard (top-quartile A-player output).
")
Assigning each KPI a threshold at each tier gives reps and managers complete clarity about where performance stands, and removes the ambiguity that creates both underperformance and unnecessary turnover.
Takeaway: The right KPI set scales with team size, data quality, and strategic maturity. Don’t measure a startup like an enterprise. Don’t manage an enterprise like a startup.
Revenue Intelligence Platforms: From Data Entry to Decision Engine
Traditional CRM dashboards are backward-looking. They show you what happened. Revenue intelligence platforms show you what is happening in your deals right now, and predict what will happen next.
The distinction matters because KPI data quality depends entirely on how that data is captured. Traditional systems rely on manual rep entries, which introduce what researchers call rep-reporting bias. Reps update pipelines optimistically near quarter-end because bad news carries political consequences.
")
According to Gartner’s research on sales technology, AI-driven revenue intelligence directly addresses this bias by capturing interaction data automatically from calls, emails, and calendar events, no rep entry required.
Platforms like Gong analyze behavioral signals that reps would never consciously log: the economic buyer went silent after the pricing call; a competitor was mentioned twice in the last meeting; the deal hasn’t had meaningful engagement in 21 days. This is a genuine causal signal, the kind that improves forecast accuracy and eliminates quarter-end surprises.
| Platform | Core Strength | Best Suited For | Est. Annual Cost |
|---|---|---|---|
| Gong | Conversation intelligence & rep coaching | Large teams, coaching-intensive cultures | ~$194K (100 users) |
| Clari + Salesloft | Predictive forecasting & pipeline discipline | Forecast-focused enterprise organizations | Custom enterprise pricing |
| 6sense | Intent-driven account prioritization | ABM & RevOps teams | $60K–$250K+/year |
| Avoma | Conversation intelligence at accessible cost | Mid-market teams (10–50 reps) | ~$29–$39/seat/month |
| Salesmotion | Signal-driven account intelligence | Outbound teams tracking external triggers | From $85/month individual |
Organizations deploying aligned, real-time revenue intelligence dashboards achieve an average 8% increase in annual revenue, a 95% reduction in reporting time (saving roughly 40 hours per month per manager), and a 15–20% improvement in forecasting accuracy.
Takeaway: Revenue intelligence platforms transform KPI data from a historical record into an active management tool. The ROI is consistent and measurable across team sizes.
Qualification Frameworks: MEDDPICCR vs. SPICED
Your KPIs are only as reliable as the quality of deals entering your pipeline. And pipeline quality begins with qualification.
The two primary B2B qualification frameworks in modern use are MEDDPICCR and SPICED. Choosing the wrong one for your deal type is a direct cause of pipeline inflation, CRM contamination, and forecast instability.
MEDDPICCR is built for complex enterprise deals ($100K+ ACV, 6-month+ cycles). It requires systematic documentation of Metrics, Economic Buyer, Decision Criteria, Decision Process, Paper Process, Identify Pain, Champion, Competition, and Risks. For multi-stakeholder enterprise transactions, that level of rigor is what separates a confident forecast from a quarter-end collapse.
SPICED is a customer-centric framework for high-velocity SaaS models ($10K–$75K ACV). It maps Situation, Pain, Impact, Critical Event, and Decision process. It’s faster, more consultative, and better suited to deals with linear buying journeys.
")
The critical insight: these frameworks aren’t mutually exclusive. For enterprise deals, use MEDDPICCR as your deal-control methodology but open each engagement with SPICED-style discovery to uncover pain, business impact, and urgency before you ever introduce pricing. For mid-market deals, run SPICED as your primary approach and layer simplified MEDDPICCR scoring on top for champion tracking and competitive intelligence.
When qualification data is consistently logged in your CRM, your Pipeline Health Ratio improves directly. A pipeline full of MEDDPICCR-qualified opportunities is structurally more predictable than one full of “interested conversations.”
Common Mistakes That Undermine Your KPI System
Understanding what to track is half the equation. Knowing what breaks the system is the other half, and it’s the half most guides skip entirely.
")
Mistake 1: Tracking too many metrics
More than 7–10 KPIs on a single dashboard triggers cognitive overload. Managers revert to confirmation bias, scanning for numbers that support what they already believe. Keep each role-specific view to 5–7 KPIs, no exceptions.
Mistake 2: Treating activity as outcomes
100 cold calls with zero meaningful conversations isn’t pipeline activity. It’s a diagnostic signal that something is broken in your targeting, messaging, or timing. Always track activities alongside their conversion rates, never in isolation.
Mistake 3: Ignoring lead source segmentation
A blended 5% conversion rate might hide a 14.6% inbound conversion rate sitting alongside a 1.7% outbound conversion rate. That’s an 8.6x performance difference invisible in your average. Segment your KPIs by lead source and you’ll find insights that blended data makes completely invisible.
Mistake 4: Setting quotas without sufficient historical data
When fewer than 50% of reps are hitting quota, investigate whether the quota itself is realistic before initiating individual performance conversations. Over-quota-setting is one of the most common and most destructive structural errors in sales management, and it’s almost always treated as a coaching problem instead.
Mistake 5: Using AI-generated activity volume as a health signal
As AI outreach tools scale, organizations produce massive synthetic activity, emails triggered, sequences executed, touchpoints logged automatically. Managers who interpret this volume as genuine pipeline engagement are making a dangerous error.
The relevant measure is actual buyer engagement, meetings held, responses received, next steps confirmed. That number is often much smaller than the activity log suggests.
Mistake 6: Neglecting no-show rates and offer rates
A high no-show rate tells you something is broken in your qualification or pre-call nurture. Prospects weren’t genuinely committed when they booked. A low offer rate, reps extending a formal offer to fewer than 80% of qualified prospects, typically reveals a conviction gap, not a lead quality problem. Both are leading indicators of future close rate deterioration that most managers catch too late.
Your 90-Day KPI Implementation Roadmap
Building a high-functioning KPI system doesn’t happen overnight, but it also shouldn’t take a year. Here’s a structured framework that sticks.
Foundation
- Select 5 core KPIs based on team size and current bottlenecks
- Write unambiguous, documented definitions for each metric
- Audit CRM for data completeness and field consistency
- Calculate your 90-day baseline for each KPI
Infrastructure
- Build role-specific dashboard views (executive, manager, rep)
- Set up automated data capture wherever possible
- Define threshold alerts: what number triggers which specific action
- Share targets and definitions openly with the full team
Activation
- Run weekly KPI reviews focused on trends, not just snapshots
- Introduce leading indicators alongside lagging ones
- Begin data-driven coaching conversations instead of intuition-based ones
- Build your first “if X drops below Y, do Z” playbook
Optimization
- Expand from 5 to 7–9 KPIs based on what your data is showing
- Assess whether your qualification framework is consistently applied in CRM
- Evaluate Pipeline Health Ratio — separate active deals from stalled ones
- Set forward-looking targets using your new 90-day baseline
Conclusion: Build the Measurement System Your Revenue Actually Deserves
Sales KPIs are not decoration on a dashboard. They are the questions your organization chooses to ask about itself. And the quality of those questions determines the quality of the decisions that follow.
The sales environment in 2026 is more demanding than at any previous point. Buying committees are larger. Sales cycles are longer. The tools available to both sales teams and buyers are more sophisticated.
In that environment, the teams that win are not always the ones working hardest. They’re the ones who know exactly where their system is working and where it’s breaking down, and who act on that knowledge faster than everyone else.
Start with five metrics. Watch for the warning signs of Goodhart’s Law. Keep your qualification data honest and your CRM clean. Segment by lead source, by team size, by deal type. And always ask not just “what does this number say?” but “why is this number changing, and what’s the right move right now?”
The goal was never a beautiful dashboard. It was always revenue. Build your KPI system to serve that goal, and everything else will follow.


")


[…] Read the Full Article → […]
[…] Read the Full Article → […]